The AI Electricity Crisis:
Will Efficiency Save Us?

GPU efficiency has improved 66x in 9 years. Token demand has grown 3,000x. The math doesn't work — and the grid is already feeling it.

66×
GPU efficiency gain
(2017–2026)
3,000×
AI token demand
growth
945 TWh
Projected DC electricity
by 2030 (IEA)
2.6 GW
US grid shortfall
by 2027 (PJM, revised)

February 4, 2026 · 12 min read · Data from EIA, EPRI/DOE, IEA, NVIDIA, Epoch AI

The Jevons Paradox of AI

In 1865, economist William Stanley Jevons observed something counterintuitive: as coal engines became more efficient, total coal consumption increased rather than decreased. The improved efficiency made coal cheaper, which expanded its use far beyond what the efficiency gains could offset.

In 2026, we're watching the same paradox play out in AI — at a pace Jevons could never have imagined.

The Jevons Paradox of AI: GPU efficiency up 66x, demand up 3000x
Figure 1: The Jevons Paradox of AI. NVIDIA GPU efficiency (green, TFLOPS/Watt normalized to V100) improved ~66x from 2017 to 2026, measured across precision formats from FP16 to FP4. AI token demand (red) grew roughly 3,000x over the same period. The net result: total electricity consumption is rising, not falling. Sources: NVIDIA datasheets, IEA, Epoch AI.

Satya Nadella invoked Jevons explicitly after the DeepSeek efficiency breakthrough in early 2025:

"As AI gets more efficient and accessible, we will see its use skyrocket, turning it into a commodity we just can't get enough of."

— Satya Nadella, CEO Microsoft (February 2025, via NPR)

The data backs him up. According to ACM SIGARCH research, every 10% improvement in AI computing efficiency has historically led to a 20-30% increase in overall deployment and usage. Inference costs fell 1,000x in three years — but demand rose 10,000x.


The Good News: Hardware Is Getting Dramatically Better

Let's start with what the optimists get right. The pace of GPU and TPU efficiency improvement is genuinely remarkable — perhaps the most aggressive hardware improvement curve since the early days of Moore's Law.

NVIDIA GPU Efficiency: 66x improvement in 9 years
Figure 2: NVIDIA GPU Compute Efficiency by Generation. From the V100 (2017) to the upcoming Rubin (2026), compute efficiency per watt improved ~66x. This includes both silicon improvements and the evolution from FP16 to FP4 precision formats — comparing within a single precision format yields ~25-30x. Rubin figures are pre-release manufacturer claims. Sources: NVIDIA datasheets, Tom's Hardware.
2-3×
Real-world tokens/MW improvement
Blackwell vs Hopper (Cockcroft independent analysis;
2x GPU-to-GPU, up to 3x at rack level)
10×
Claimed token cost reduction
Rubin vs Blackwell (NVIDIA, pre-release)
67%
Better performance per watt
Google TPU v6 Trillium vs v5e
30×
Performance per watt improvement
Google TPU v7 Ironwood vs v1 (2018)

The token cost decline has been equally dramatic:

The 1000x Token Price Collapse (2022-2026)
Figure 3: The 1,000x Token Price Collapse. The cost to achieve GPT-3-equivalent performance fell from $20/M tokens (Nov 2022) to $0.06/M (Oct 2024) — a 333x decline. Frontier model pricing dropped similarly: GPT-4-class output went from $60/M to $2.19/M (DeepSeek R1). Sources: Epoch AI, OpenAI, Anthropic, DeepSeek API pricing.
The efficiency case in a nutshell

If you froze AI demand at 2024 levels and deployed Blackwell + Rubin hardware to replace existing data center fleets, total AI electricity consumption would fall by roughly 70-80%. The hardware is genuinely, dramatically more efficient.

But of course, demand isn't frozen. Not even close.


The Bad News: Demand Is Growing Even Faster

The scale of AI token generation is difficult to comprehend. Here's what the hyperscalers reported in their most recent earnings calls:

Token Demand Explosion: The Insatiable Appetite for AI Compute
Figure 4: Monthly Token Processing by Provider. Google alone processes 980 trillion tokens per month — doubled from 480T in just six months. Microsoft Azure processes 50T/month with 7x YoY growth. The aggregator OpenRouter saw 3,800% growth in 12 months. Sources: Google, Microsoft, OpenRouter earnings/reports.

These numbers are staggering, but they represent mostly chat-based interactions. The next wave — agentic AI — is orders of magnitude more token-intensive:

Agentic AI: The demand multiplier

A typical chat interaction uses 500-1,000 tokens. An agentic coding session (like Claude Code resolving a GitHub issue) uses 500,000 to 2,000,000 tokens — a 1,000x increase per task. Gartner predicts 40% of enterprise apps will integrate AI agents by end of 2026, up from <5% in 2025.

This creates the scissors effect — where per-unit costs fall but total expenditure rises:

The Scissors Effect: Cheaper Tokens, Higher Total Cost
Figure 5: The Scissors Effect. Per-token costs (green, left axis) have plummeted 10,000x since 2022. But total AI inference spend (red) and data center electricity consumption (orange) are rising faster than costs are falling. The AI API market is projected to grow from $41B (2024) to $373B (2032). Sources: Epoch AI, IEA, market research.

"Inference costs fell 1,000x in 3 years, but demand rose 10,000x — net energy consumption increased dramatically."

— ByteIota AI Infrastructure Analysis, 2026

Enterprise surveys consistently find that a majority of organizations report generative AI costs higher than expected at production scale — precisely because cheaper tokens drive exponentially more usage. As BCG's 2025 AI Radar survey noted, only 26% of companies have successfully moved past the pilot stage to capture meaningful value.


The Evidence: What's Already Happening State by State

This isn't a theoretical future. The divergence between data-center-heavy states and the rest of the country is already visible in EIA electricity sales data.

We split US states into two groups using EPRI data: states where data centers consume >5% of total electricity (VA, ND, NE, IA, OR, WY, NV, AZ, UT) versus control states of similar size with <1% data center presence.

Electricity Demand: Data Center States vs Control States
Figure 6: State-Level Electricity Demand Divergence. Since 2015, data-center-heavy states saw ~20% electricity growth while control states grew only ~1.4%. The gap widened significantly after 2022. Source: EIA-861 actual retail electricity sales; EPRI state classification.

The divergence is even more dramatic when you look at commercial electricity specifically — which is the EIA category that includes data centers:

Commercial Electricity in Data Center States
Figure 7: Commercial Electricity in DC-Heavy States vs National Sectors. Commercial electricity sales in data-center-heavy states grew 40%+ since 2015, dramatically outpacing national commercial (+~7%), residential, and industrial trends. Data centers are classified as "commercial" in EIA reporting. Source: EIA-861.

Virginia: The Canary in the Coal Mine

Virginia is ground zero for the AI electricity crisis. Northern Virginia (Loudoun, Prince William, and Fairfax counties) hosts the highest concentration of data centers in the world. According to EPRI, data centers already consume 25.6% of Virginia's total electricity — roughly one in four watts generated in the state goes to a data center.

Virginia: The Canary in the Coal Mine
Figure 8: Virginia Deep Dive. Left: Virginia's commercial electricity trajectory vs the national average, with residential as control. Right: Data center share of total state electricity (EPRI 2023 data). Virginia at 25.6% is 2x the next-closest state. Sources: EIA-861, EPRI/IM3 via DOE.

A December 2024 report by Virginia's JLARC (Joint Legislative Audit and Review Commission) found that under unconstrained growth, data centers could drive a 183% increase in the state's total electricity usage by 2040. Dominion Energy's capacity auction prices for the Virginia zone have already spiked 833%.

What Virginia tells us about everywhere else

Virginia didn't plan for a quarter of its electricity to go to data centers. It happened gradually, then suddenly. The EPRI projections show other states on the same trajectory — North Dakota (15.4%), Nebraska (11.7%), Iowa (11.4%), Oregon (11.4%) are all past the 10% mark. Under high-growth scenarios, multiple states could see 25%+ data center shares by 2030.


The Wall: Where Efficiency Runs Out of Road

Data center operators have been improving Power Usage Effectiveness (PUE) — the ratio of total facility power to IT equipment power — for two decades. But this lever is nearly exhausted:

Data Center Efficiency Can't Keep Up
Figure 9: PUE Plateau and AI's Growing Share. Left: Industry average PUE has barely moved since 2013 (1.65 → 1.56). Google is at 1.09, approaching the theoretical minimum of 1.0. Right: AI's share of data center power is projected to grow from 5% (2022) to 50% (2030). Sources: Uptime Institute Global Data Center Survey 2024, Google Sustainability Reports, IEA.

The uncomfortable truth: there are only three levers to reduce AI's electricity footprint:

1. Silicon efficiency

Improving at ~3x per GPU generation (every 2-3 years). Genuine and impressive, but capped by physics. Each generation also increases TDP: V100 was 300W, Rubin is 1,800W.

2. Algorithmic efficiency

Accounts for ~35% of capability improvement since 2014 (Epoch AI). Distillation, quantization, and MoE architectures help but are one-time gains per technique.

3. Facility efficiency (PUE)

Plateaued at 1.55-1.58 industry-wide since 2013. Hyperscalers at 1.09-1.12. Approaching theoretical limits. Not a meaningful lever anymore.

The missing lever: demand reduction

Nobody is reducing demand. Enterprise AI adoption went from 55% to 78% in two years. 91% of developers use AI tools. Agentic workloads are 1,000x more token-intensive than chat.


Four Scenarios: What Happens Next

We modeled four scenarios for global data center electricity consumption through 2030, balancing demand growth projections against hardware efficiency improvements:

Will Efficiency Save Us? Four Scenarios
Figure 10: Four Scenarios for AI Electricity Demand (2022-2030). Red: IEA base case. Dark red: Accelerated demand from agentic AI. Green: Optimistic scenario where Blackwell/Rubin efficiency fully offsets growth. Blue: Realistic middle path where efficiency helps but can't keep up. Hardware milestones (Blackwell, Rubin) annotated. Sources: IEA, NVIDIA, EPRI, authors' analysis.
540 TWh
Optimistic: Efficiency fully offsets demand.
Requires demand growth to slow AND
rapid Blackwell/Rubin deployment.
1,900 TWh
Accelerated: Agentic AI drives
quadratic token growth.
~4.5% of global electricity.

The EPRI projections for individual states tell a similarly sobering story:

EPRI Projections: DC Share by State through 2030
Figure 11: EPRI State-Level Projections Under Four Growth Scenarios. Virginia could see data centers consuming 50% of state electricity under the highest growth scenario by 2030. Even the low-growth scenario pushes Virginia past 30%. North Dakota, Nebraska, Iowa, and Oregon all reach 20-30% under high-growth assumptions. Source: EPRI/IM3 Data Center Load Projections (DOE, Dec 2025).
The infrastructure reality check

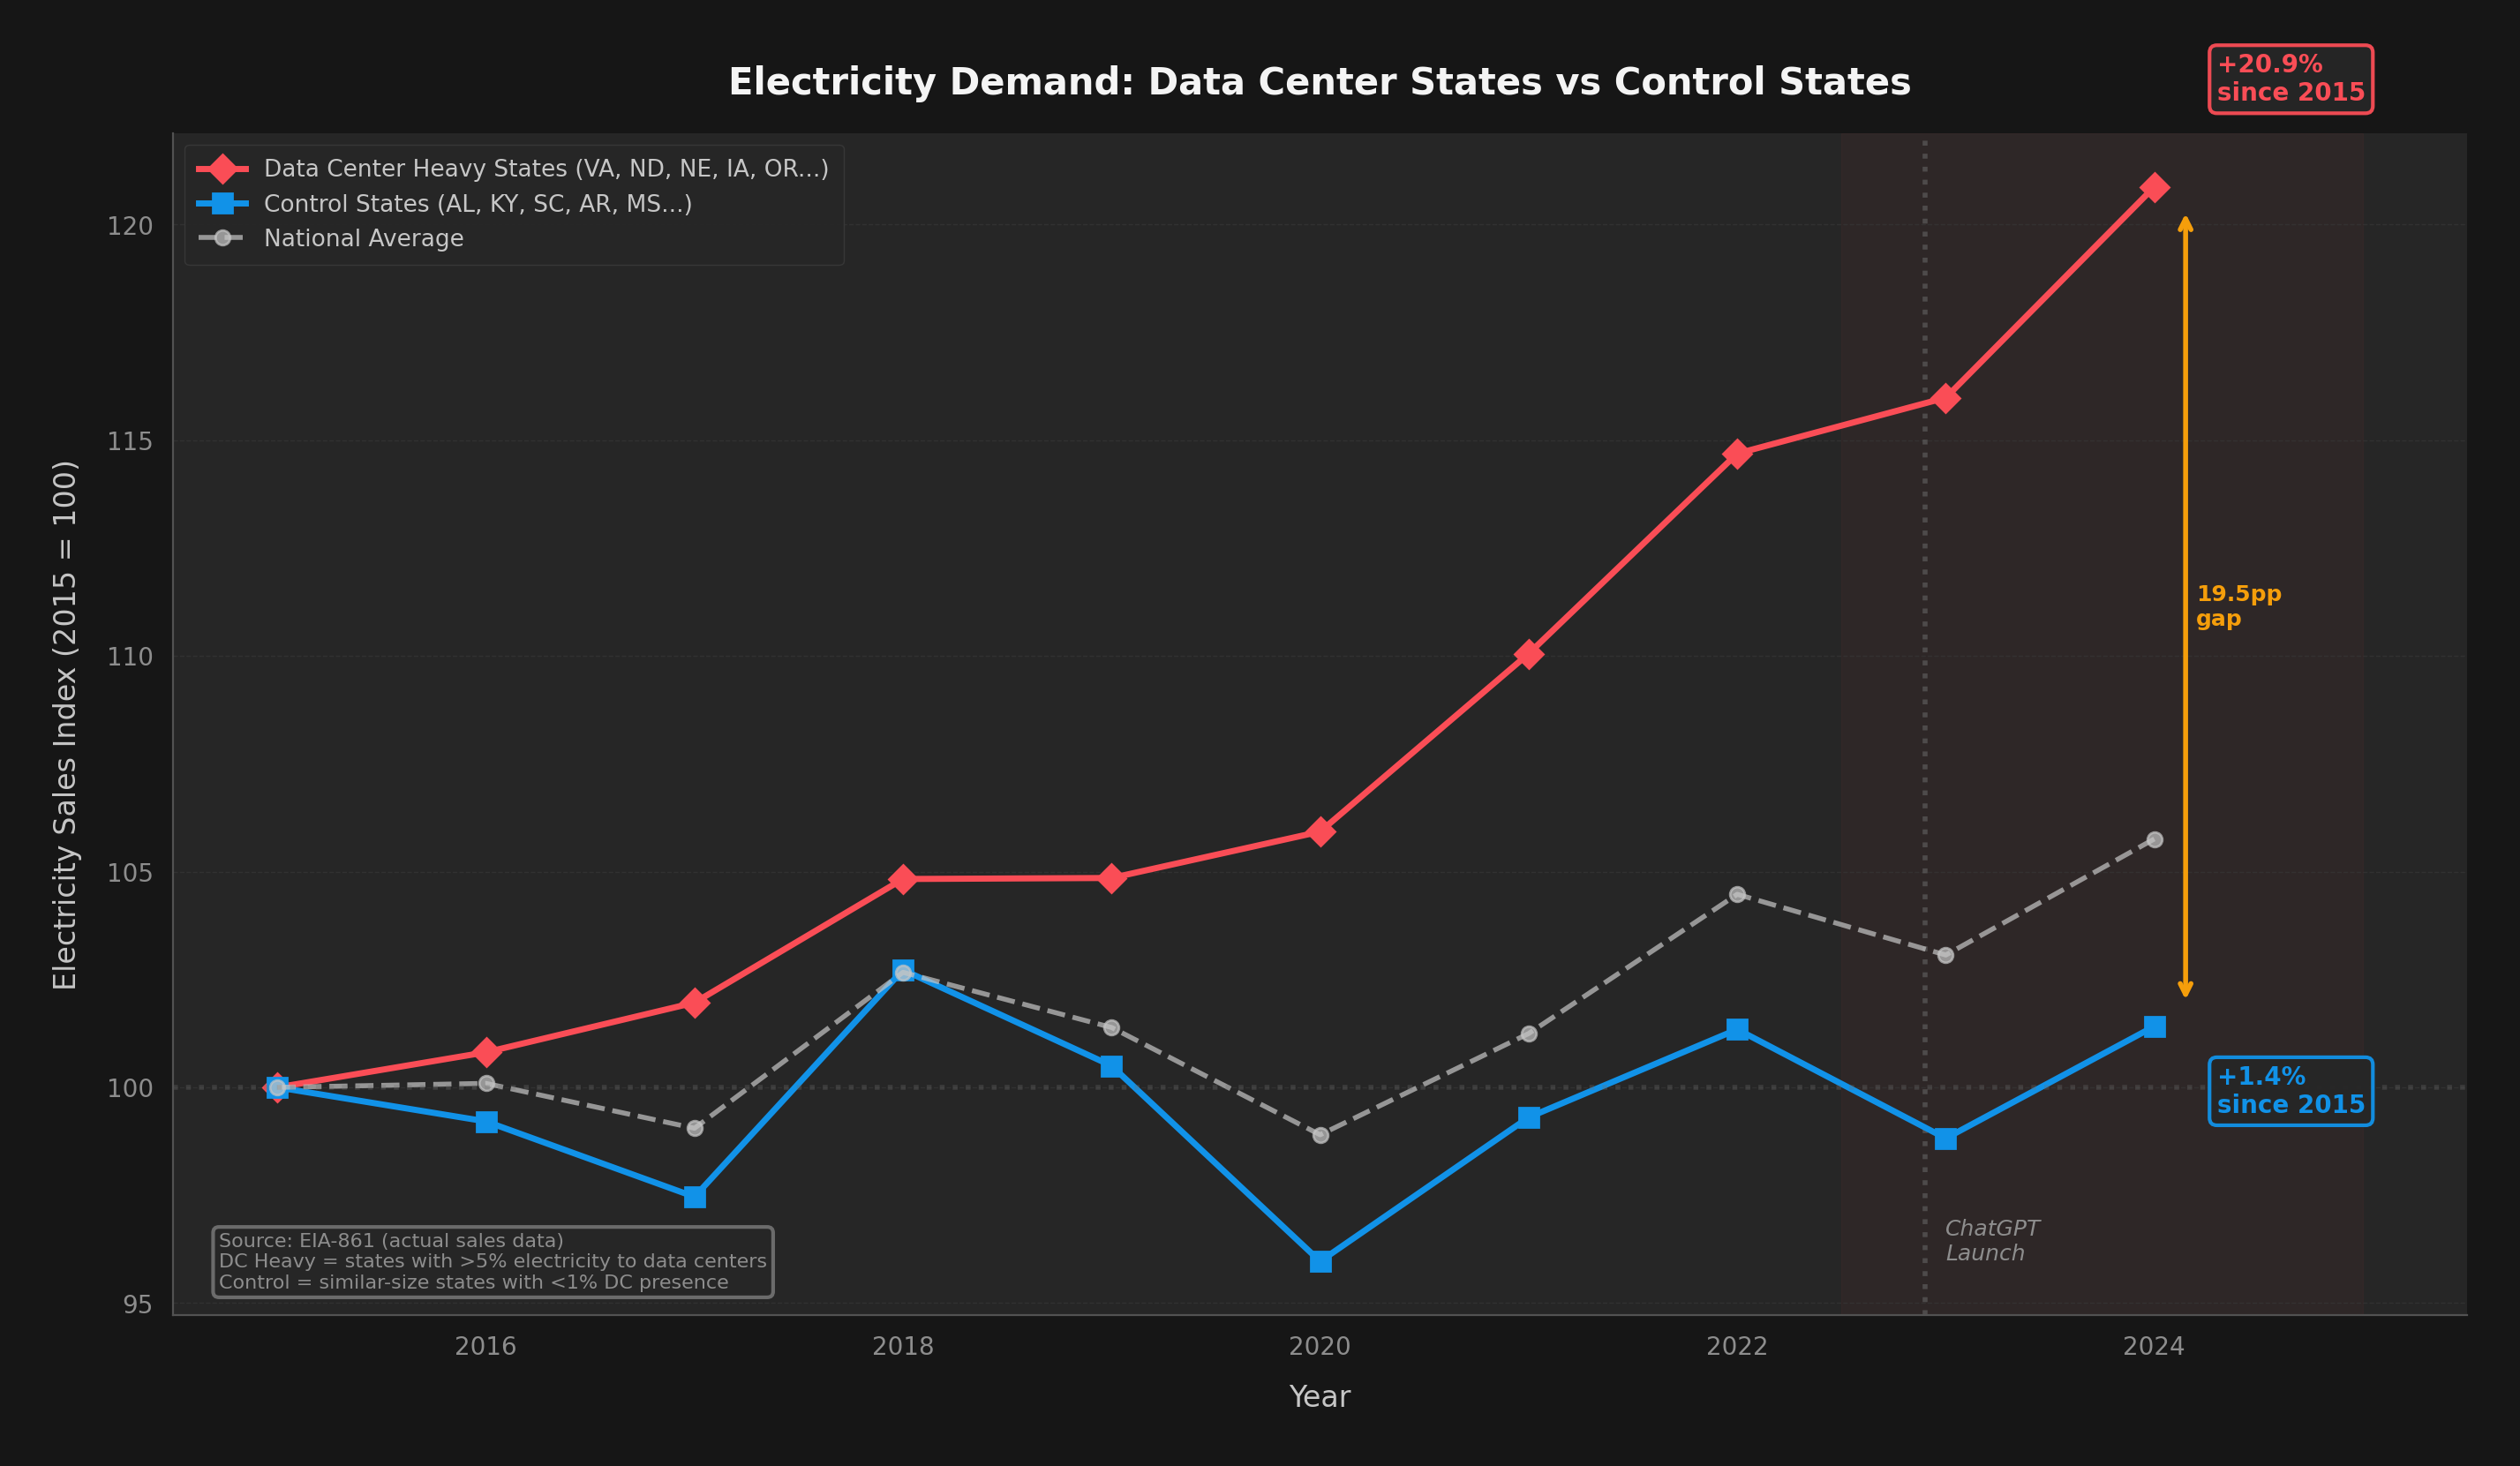
PJM, the grid operator covering Virginia and 12 other states (65 million people), initially projected a 6-gigawatt shortfall below reliability requirements by 2027. After stricter data center vetting, PJM revised this to approximately 2.6 GW in late 2025 — still a significant gap. Coal plants in Kansas City and West Virginia have already delayed closures to meet AI-driven demand. Data center water consumption is projected to double or quadruple by 2028, reaching 150-280 billion liters annually in the US alone.


What CTOs Should Do About It

The question isn't whether AI electricity demand will be a problem. It already is. The question is whether your organization is positioned for a world where compute is abundant but energy-constrained.

01

Measure energy per outcome, not tokens

Track electricity cost per deployed feature, not per token. The METR study showed developers are 19% slower with AI despite thinking they're faster. If your agents use 10x more tokens but ship the same output, that's a Jevons problem.

02

Plan for hardware transitions

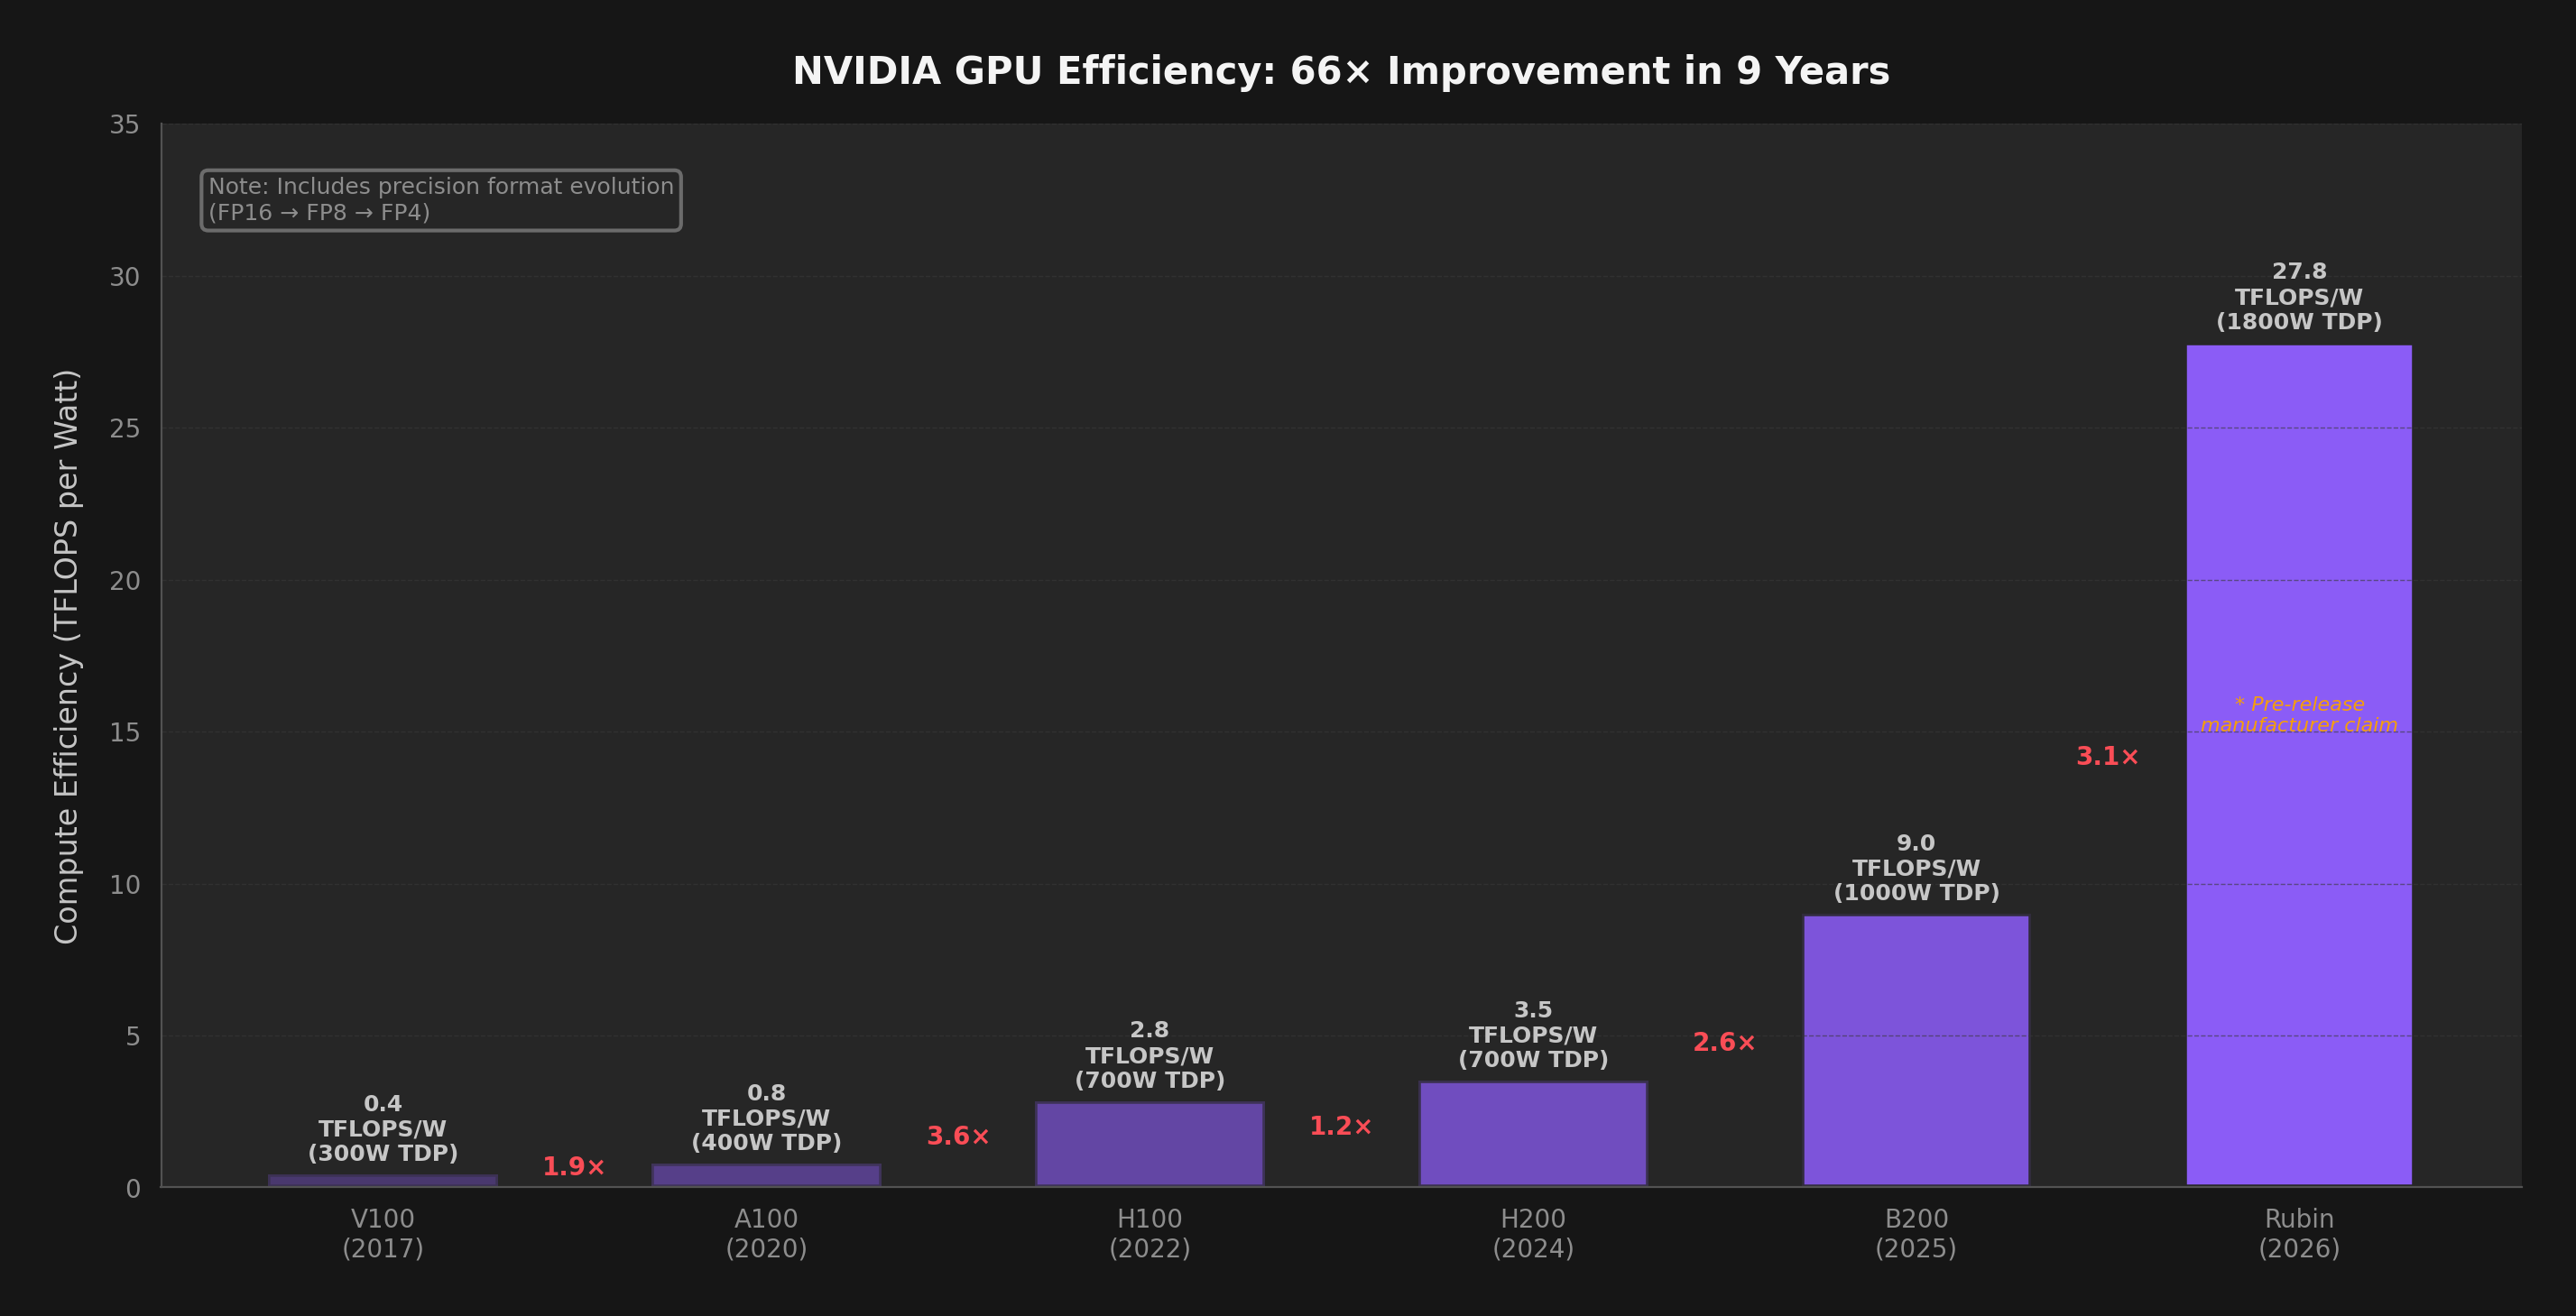
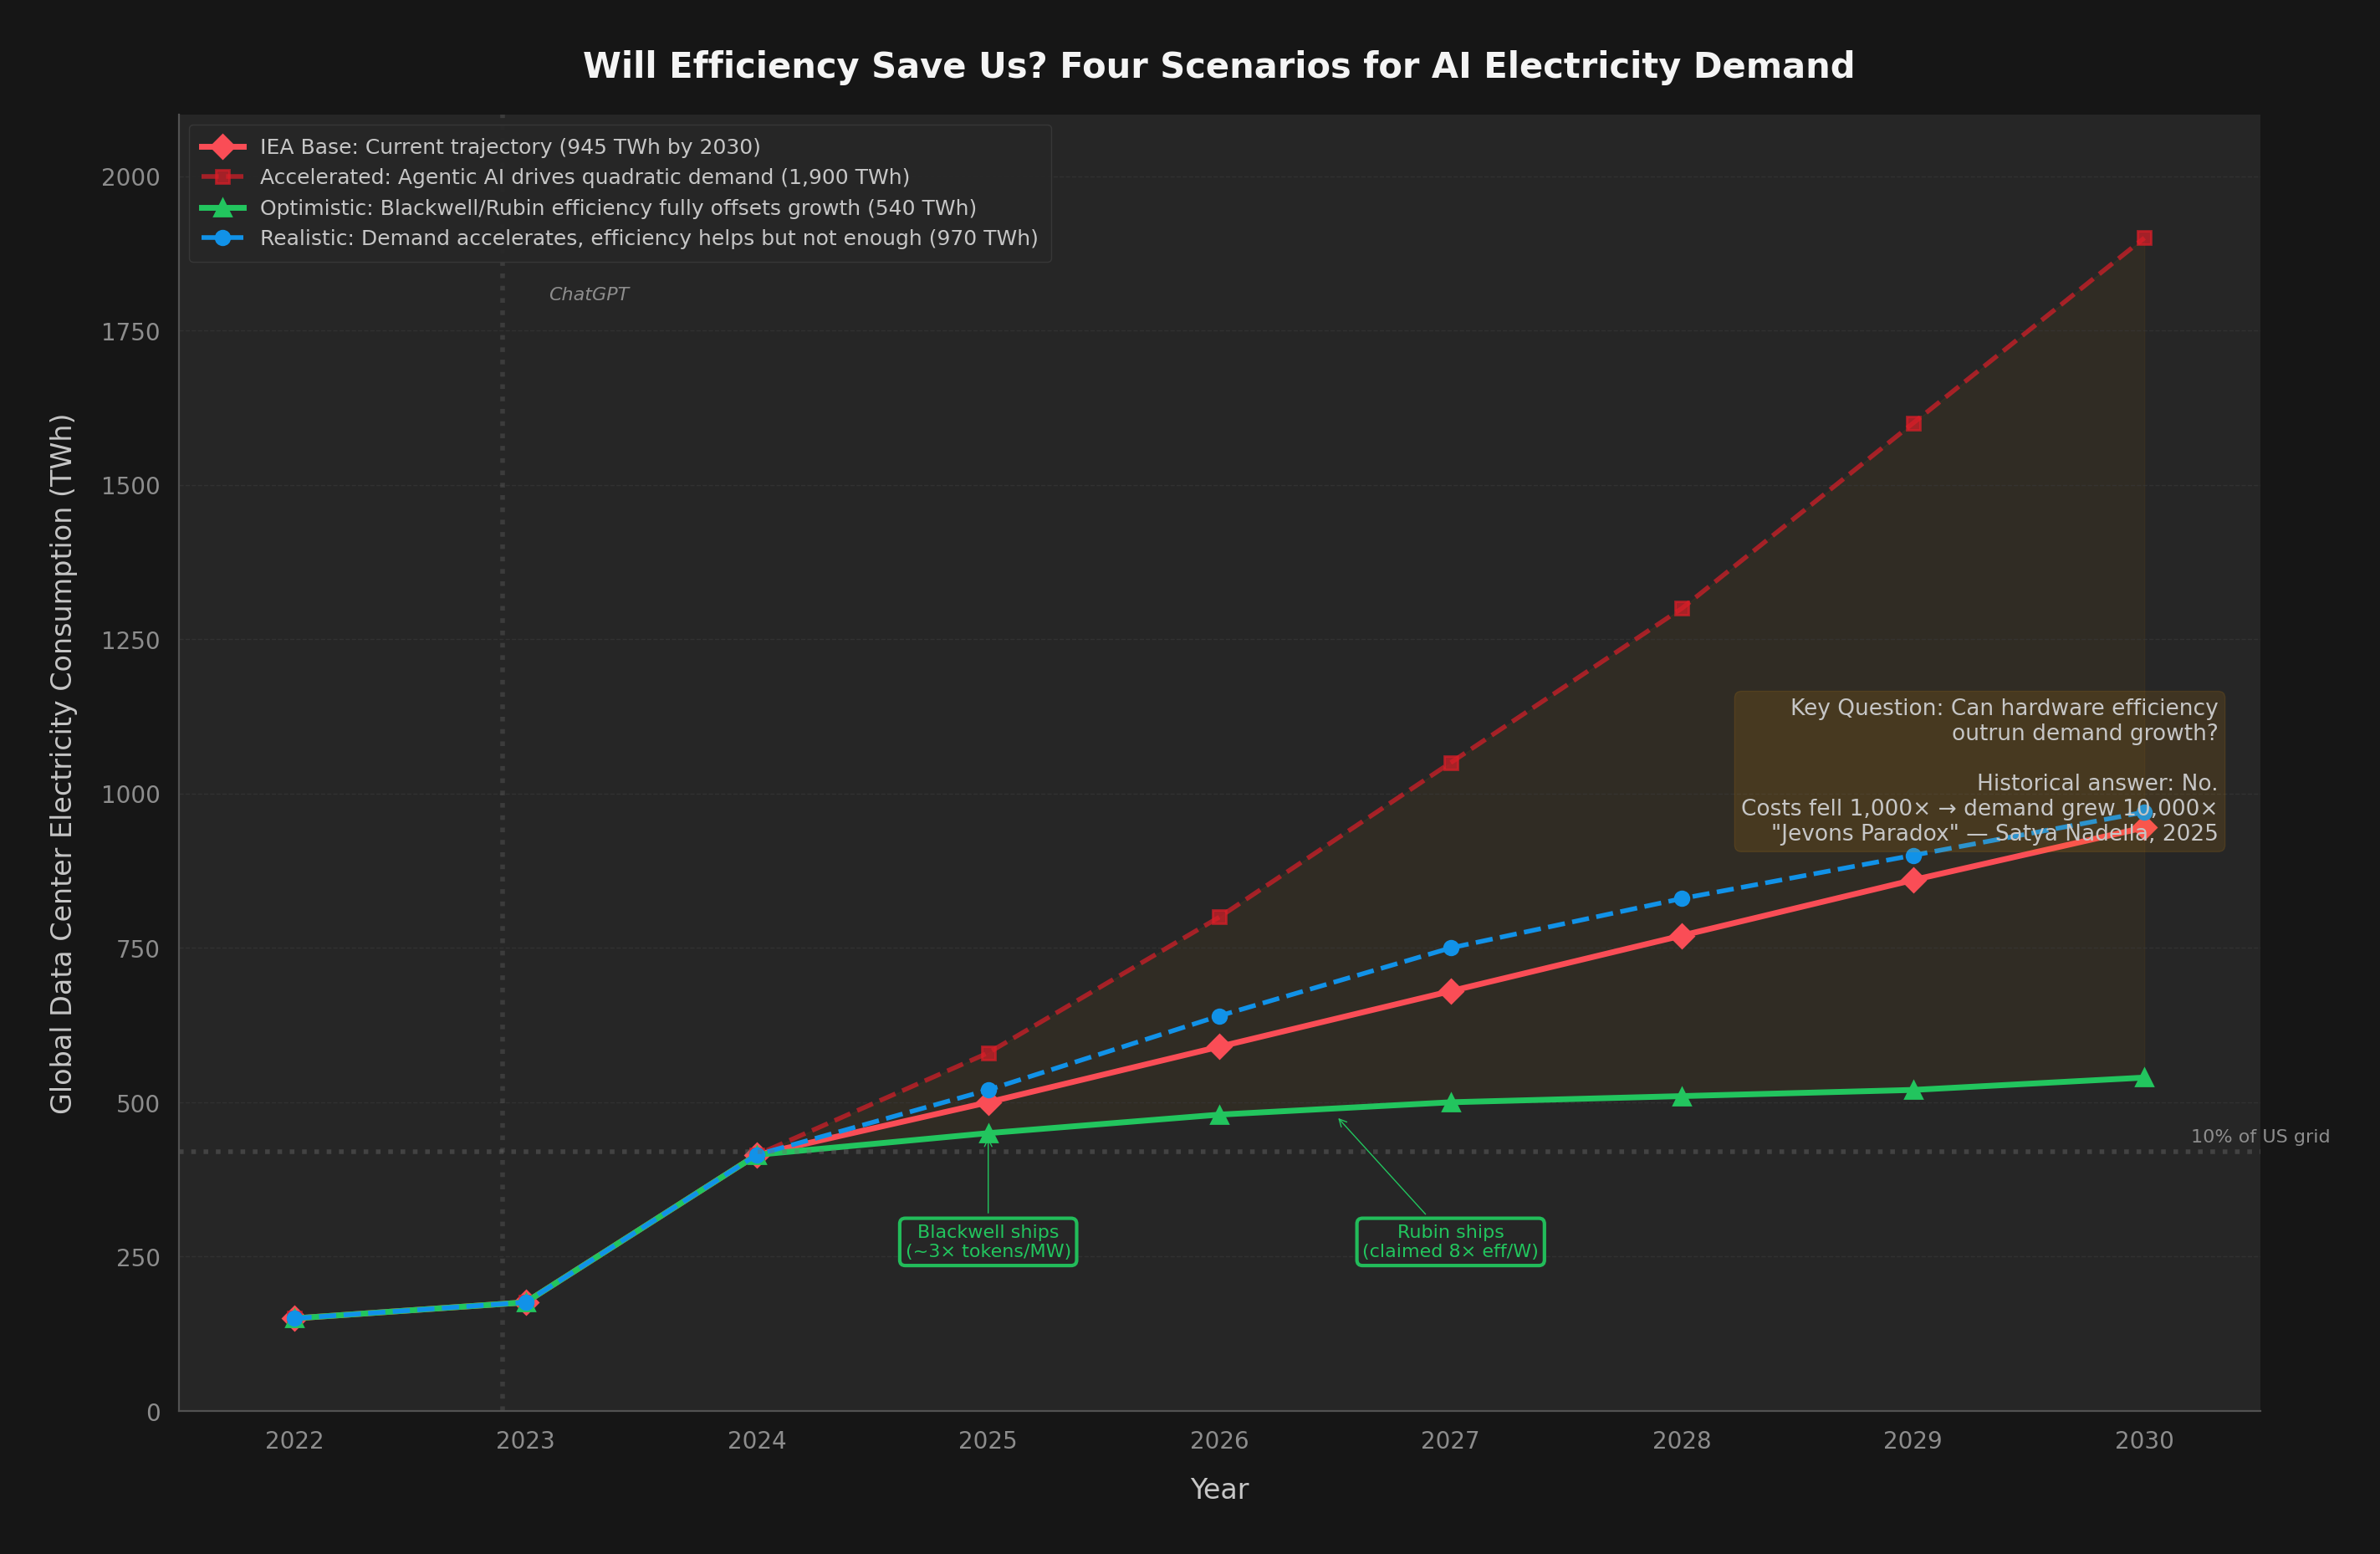
Blackwell delivers 2-3x real-world efficiency gains. Rubin claims 10x more. Build your inference infrastructure to swap hardware generations quickly. Efficiency gains only help if you deploy them.

03

Consider smaller, fine-tuned models

The SERA paper achieved 54.2% on SWE-Bench for $2,000 in training costs. For many use cases, a fine-tuned 7B model running on-premise uses 100x less energy than a frontier API call. Not every task needs Opus.

04

Watch your data center geography

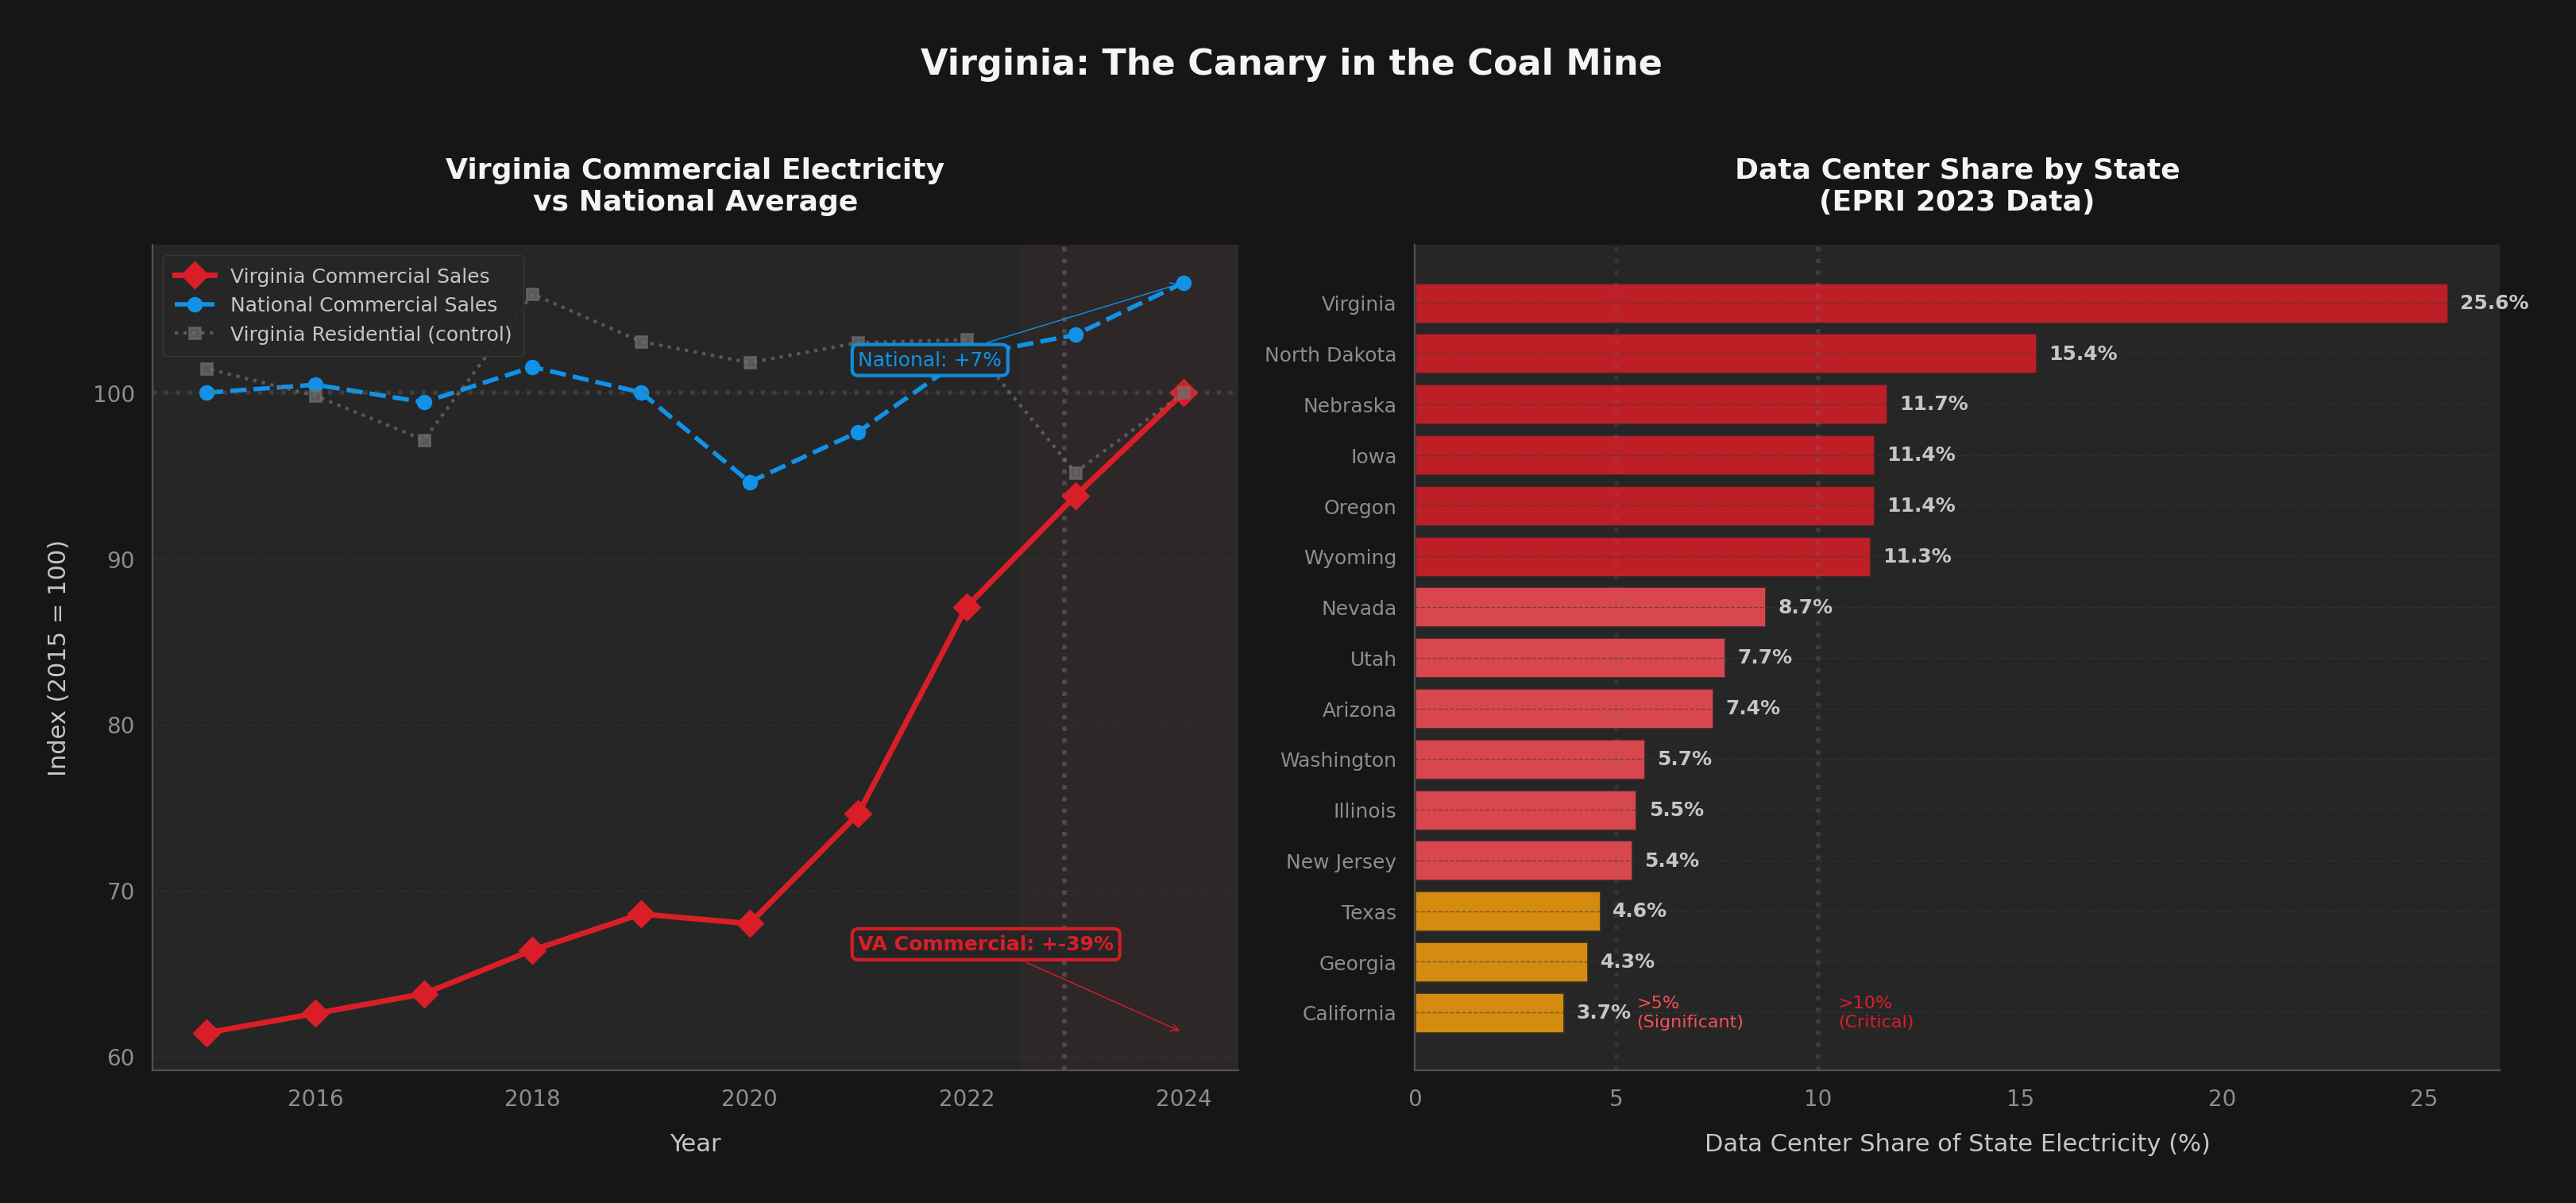
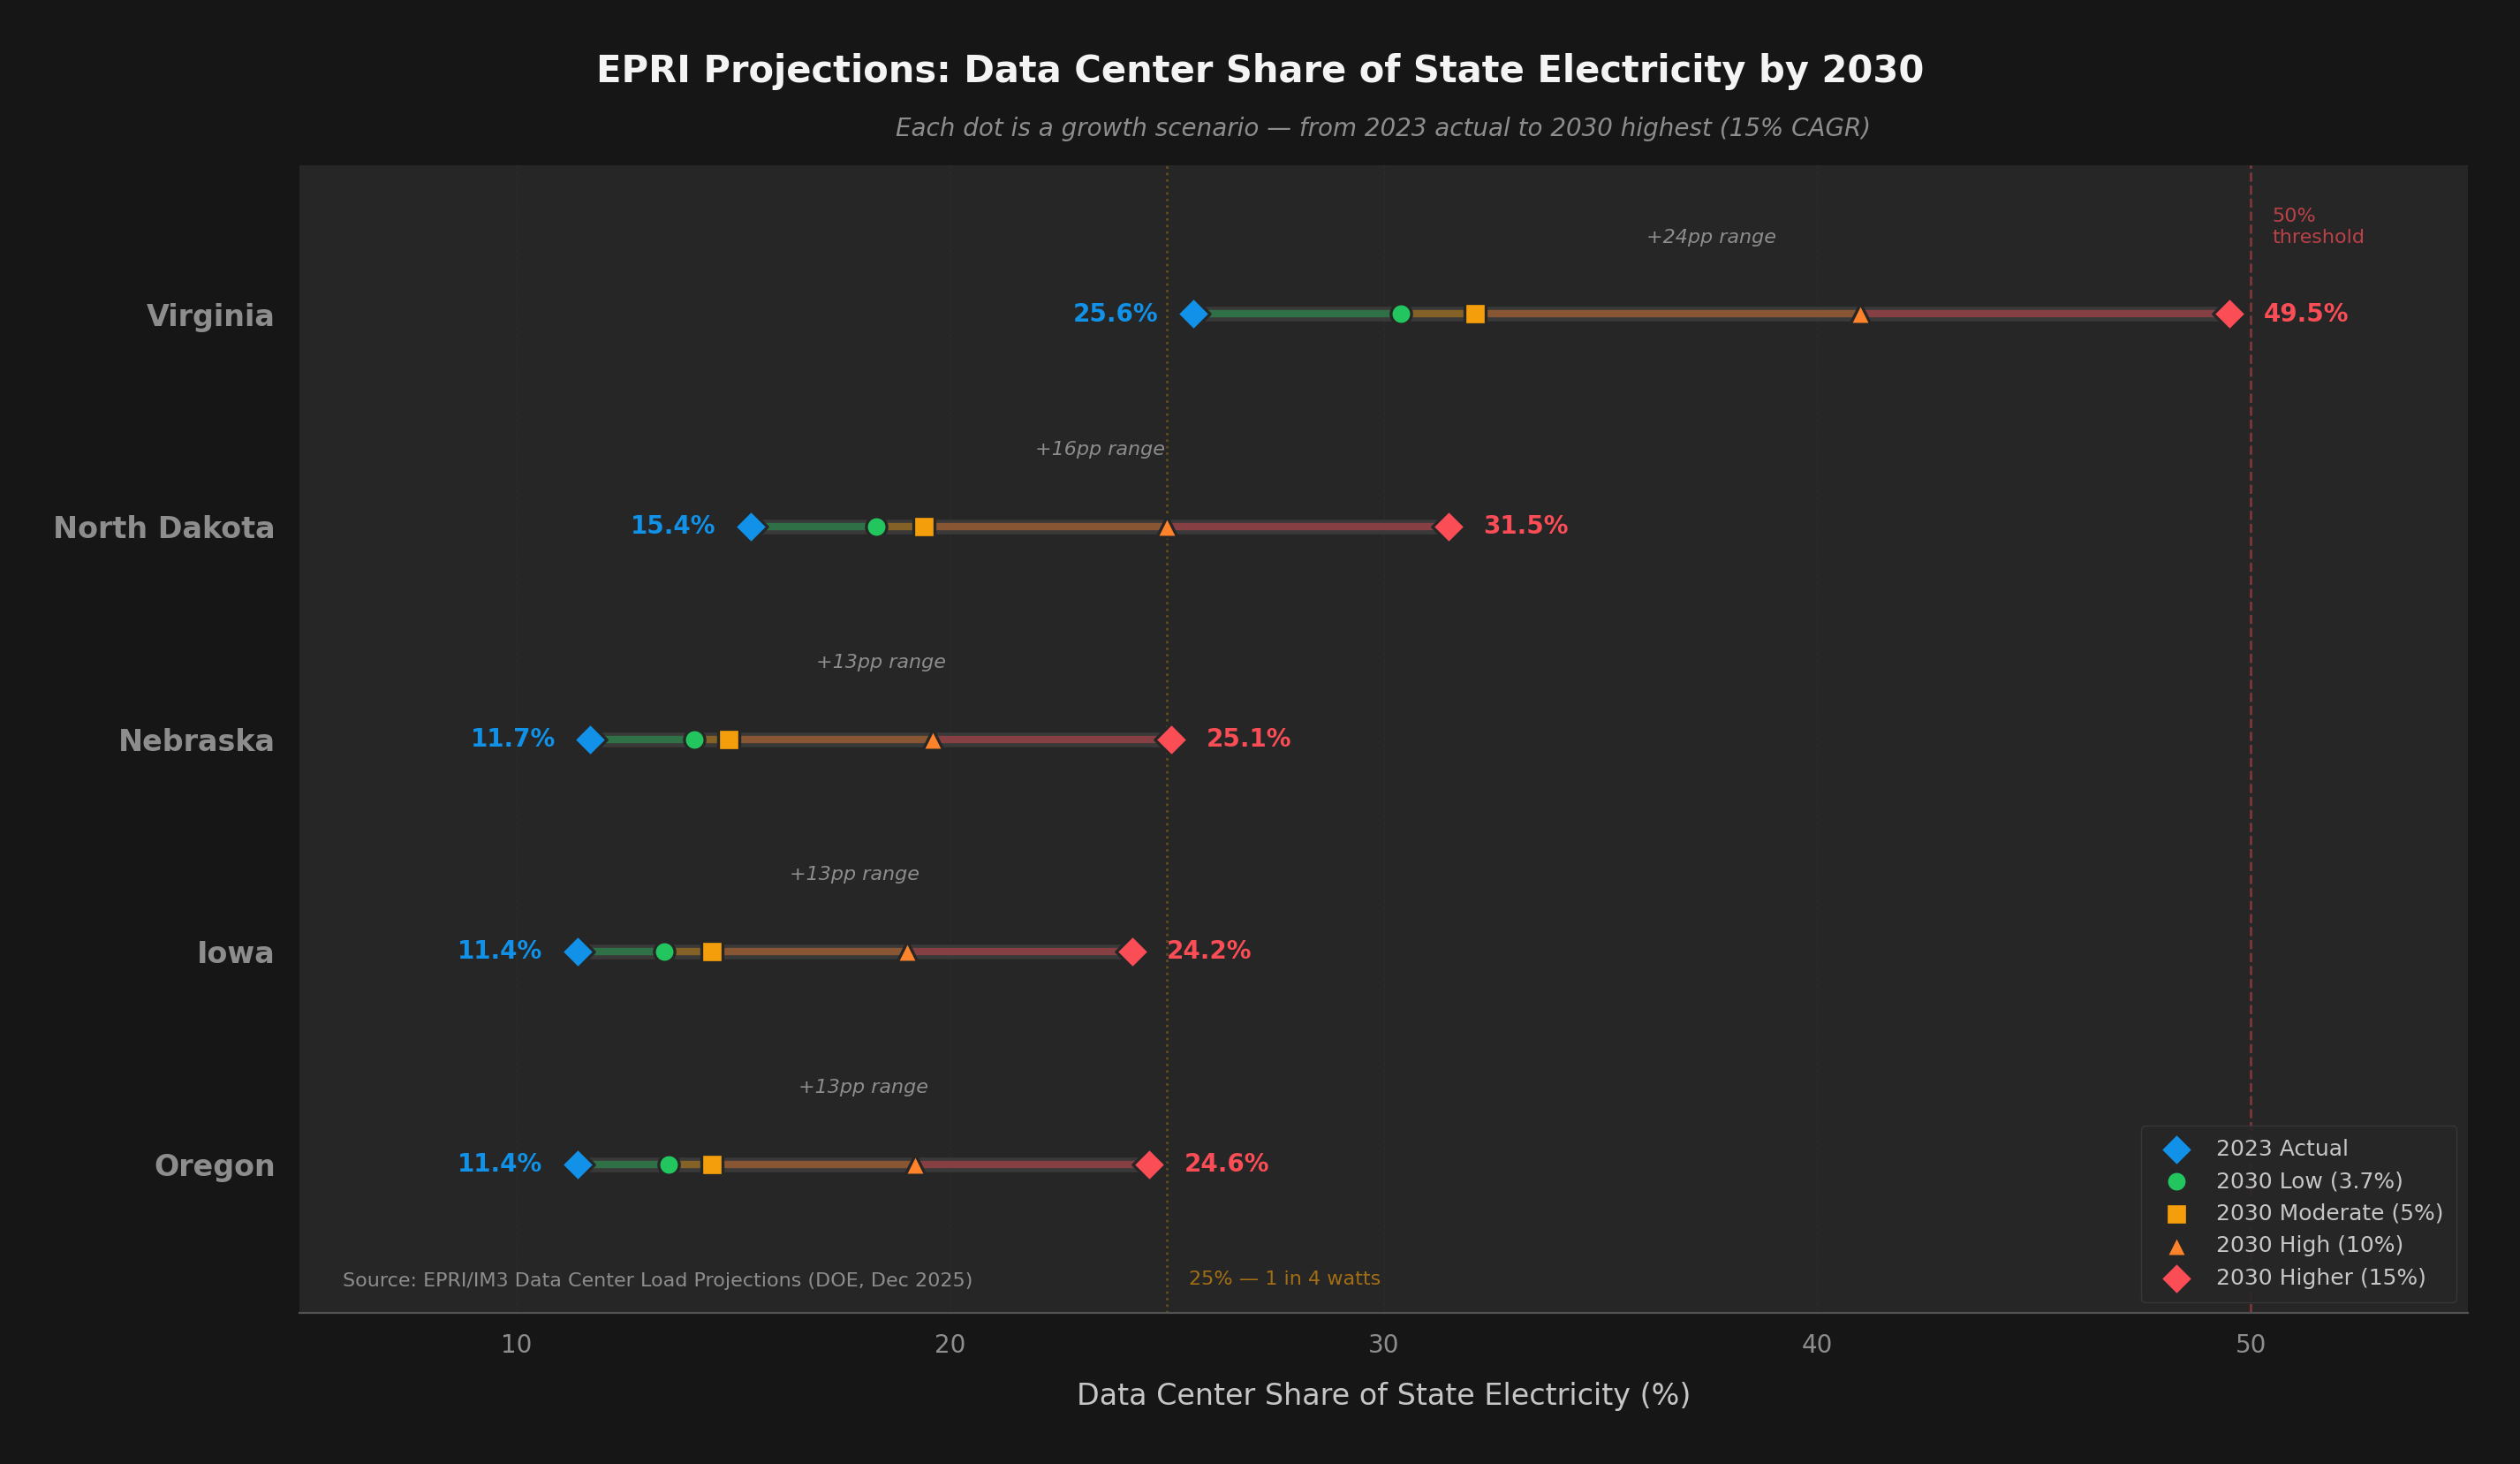
If your cloud provider's primary region is in Virginia, Texas, or Oregon, factor in rising electricity costs and potential capacity constraints. Diversify regions. Virginia's capacity auction prices spiked 833%.

05

Budget for the Jevons effect

When you roll out agentic AI, expect 5-10x the compute budget of chat-based AI. A single Claude Code session can consume 2M tokens. Multiply by your engineering team size. Then multiply by continuous integration.

06

Treat energy as a first-class constraint

Energy is becoming the binding constraint on AI scaling — not model quality, not talent, not data. Companies that optimize for energy efficiency will have a structural cost advantage by 2028.


The Bottom Line

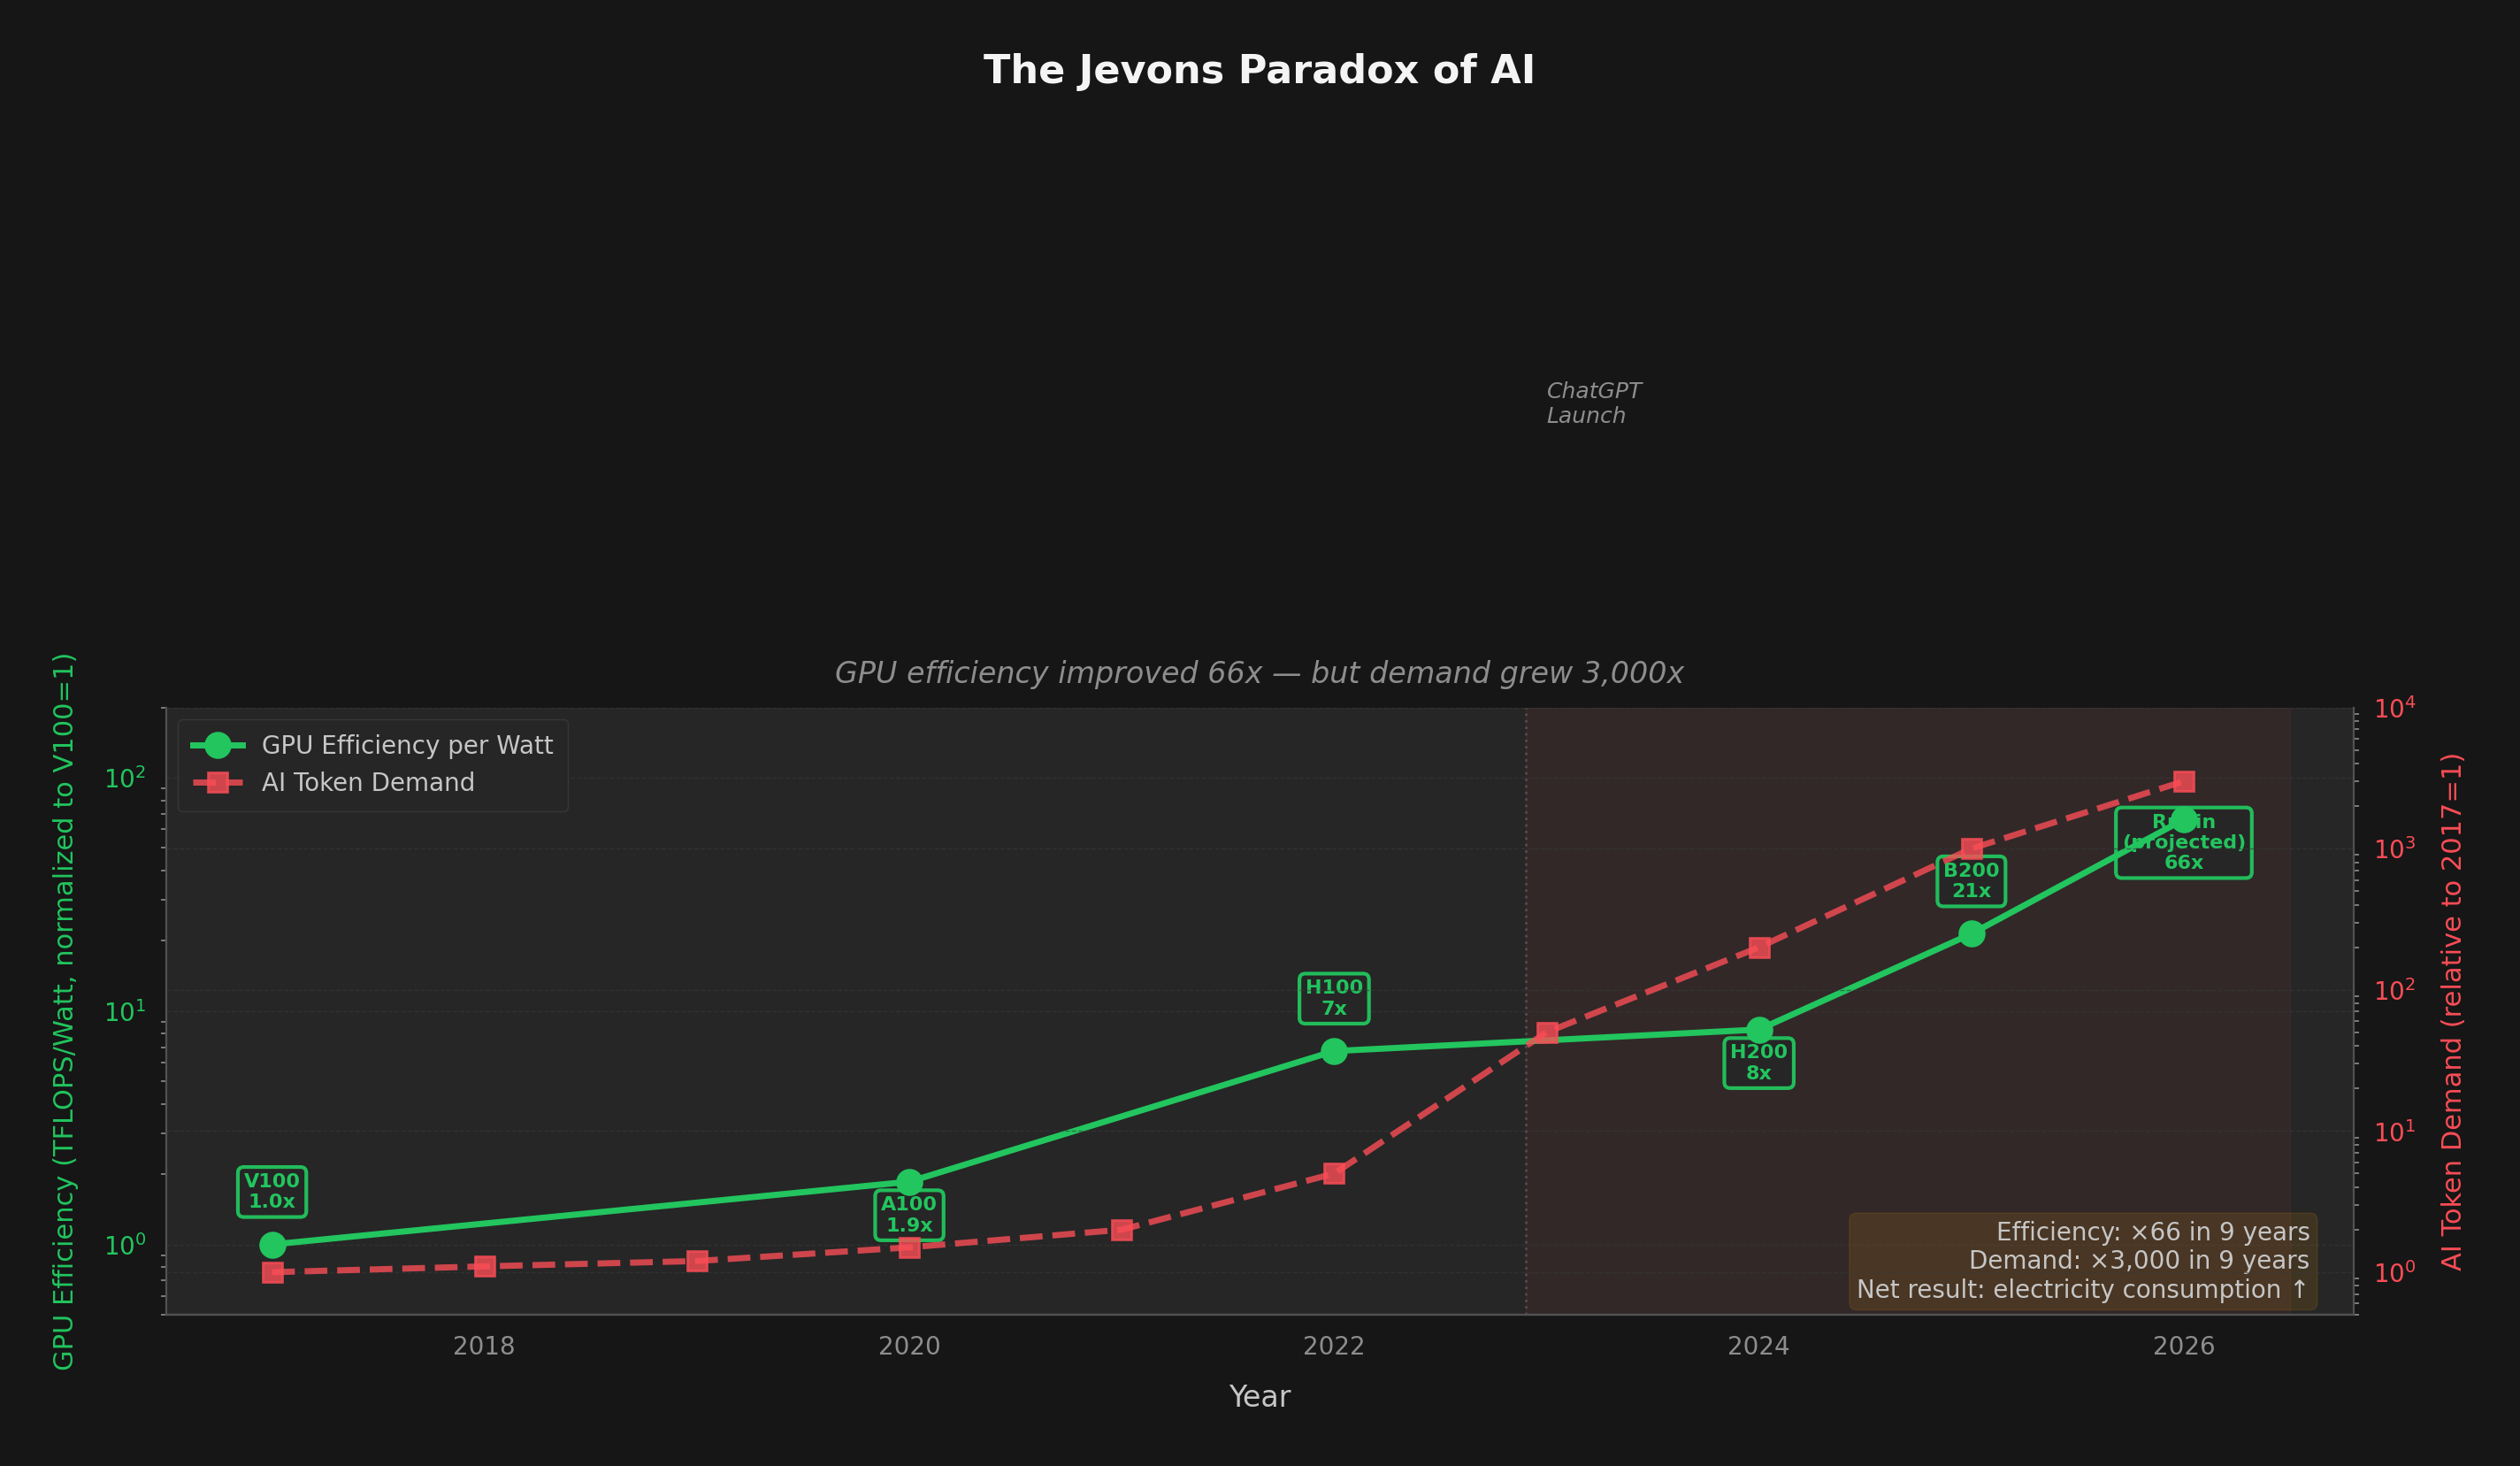
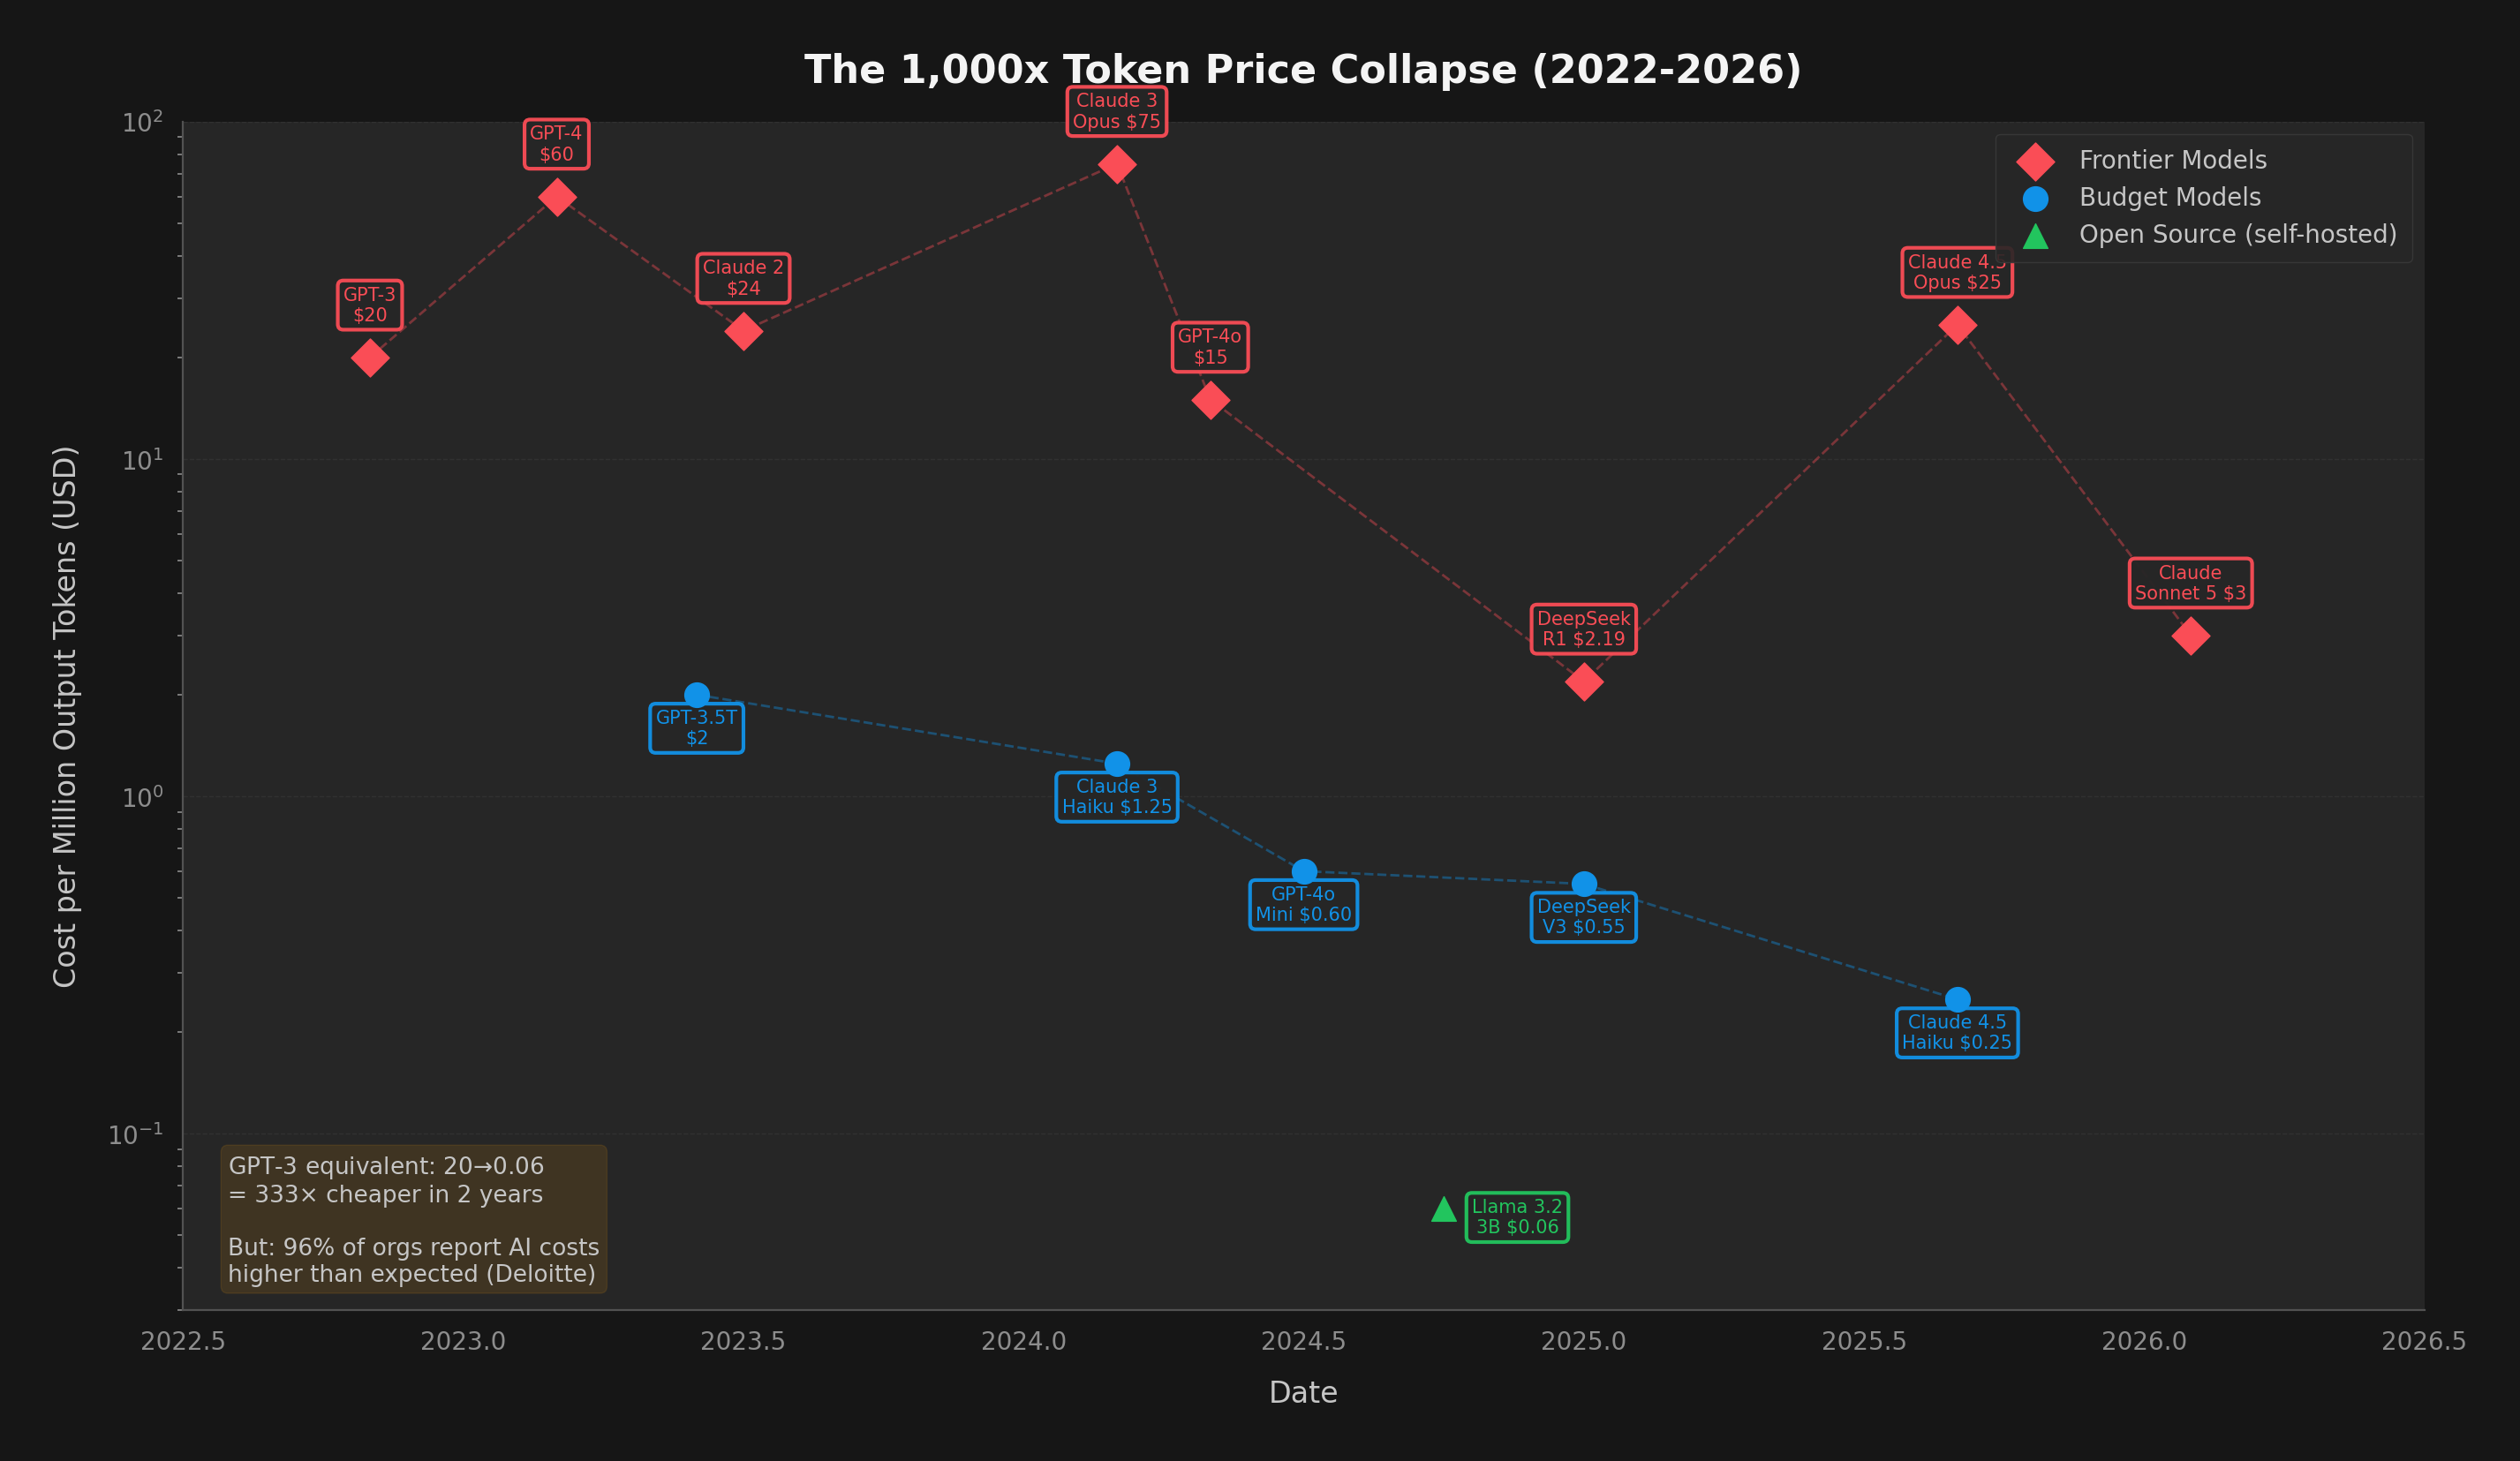
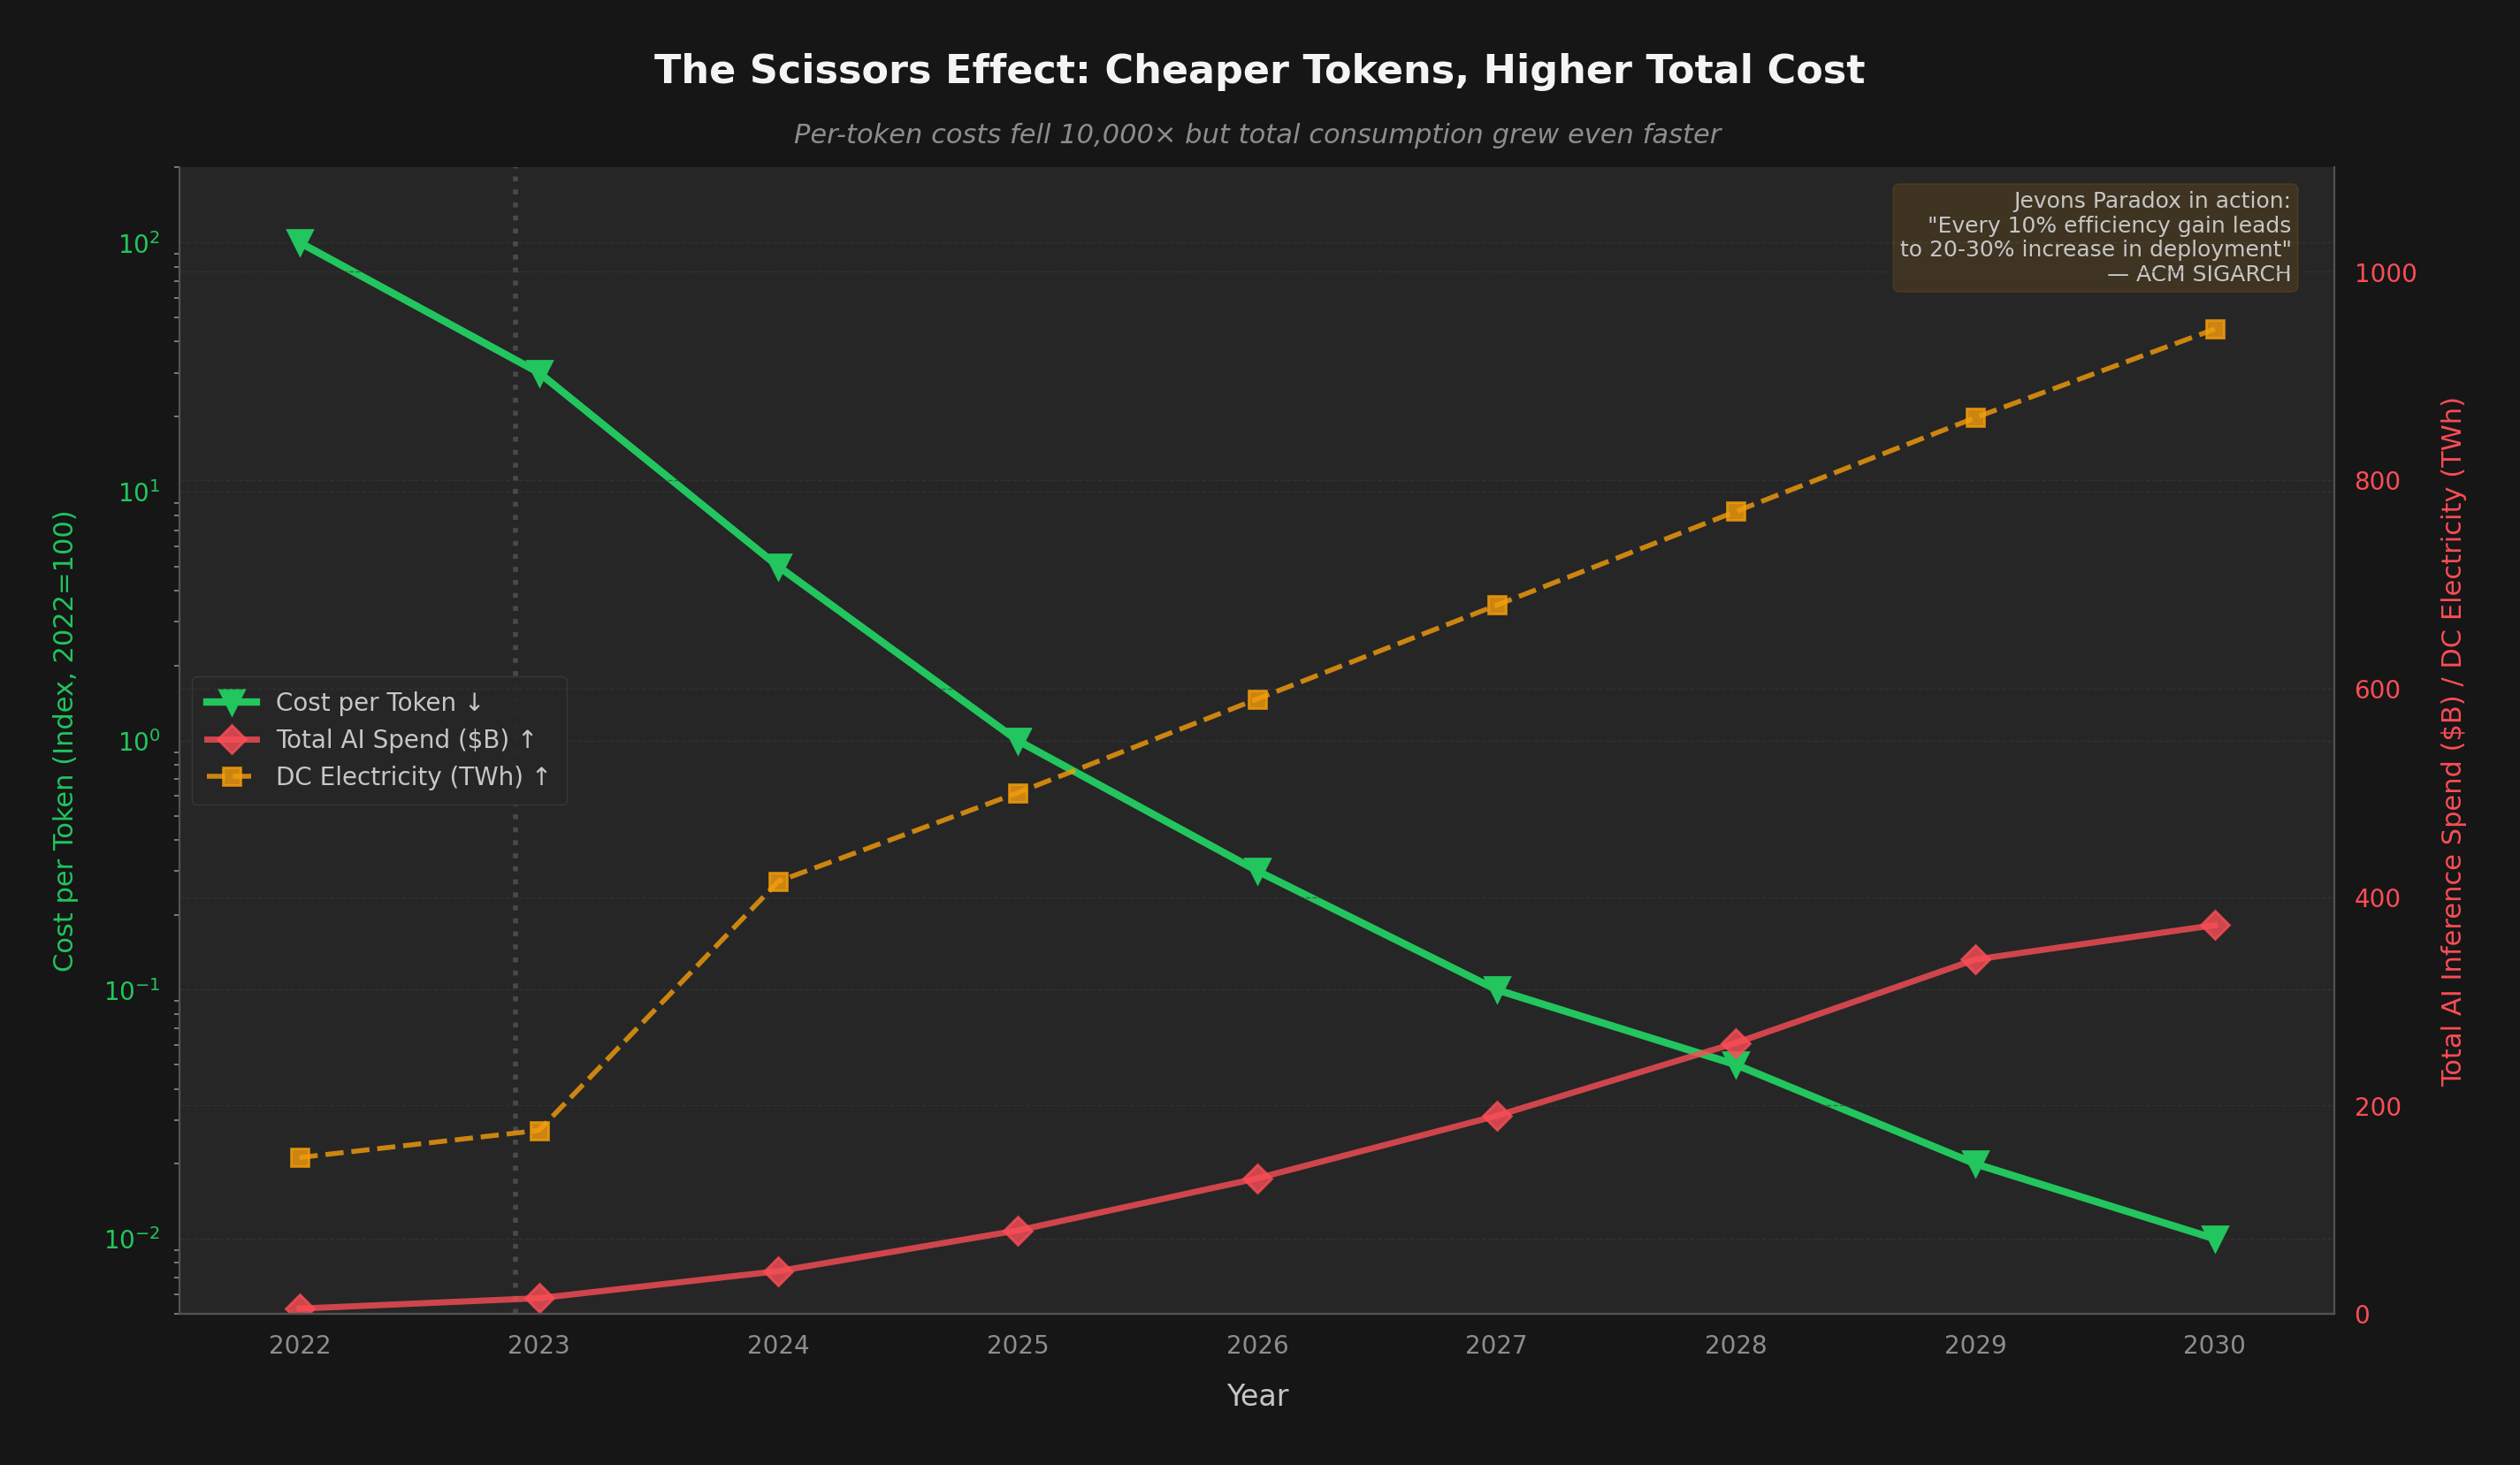
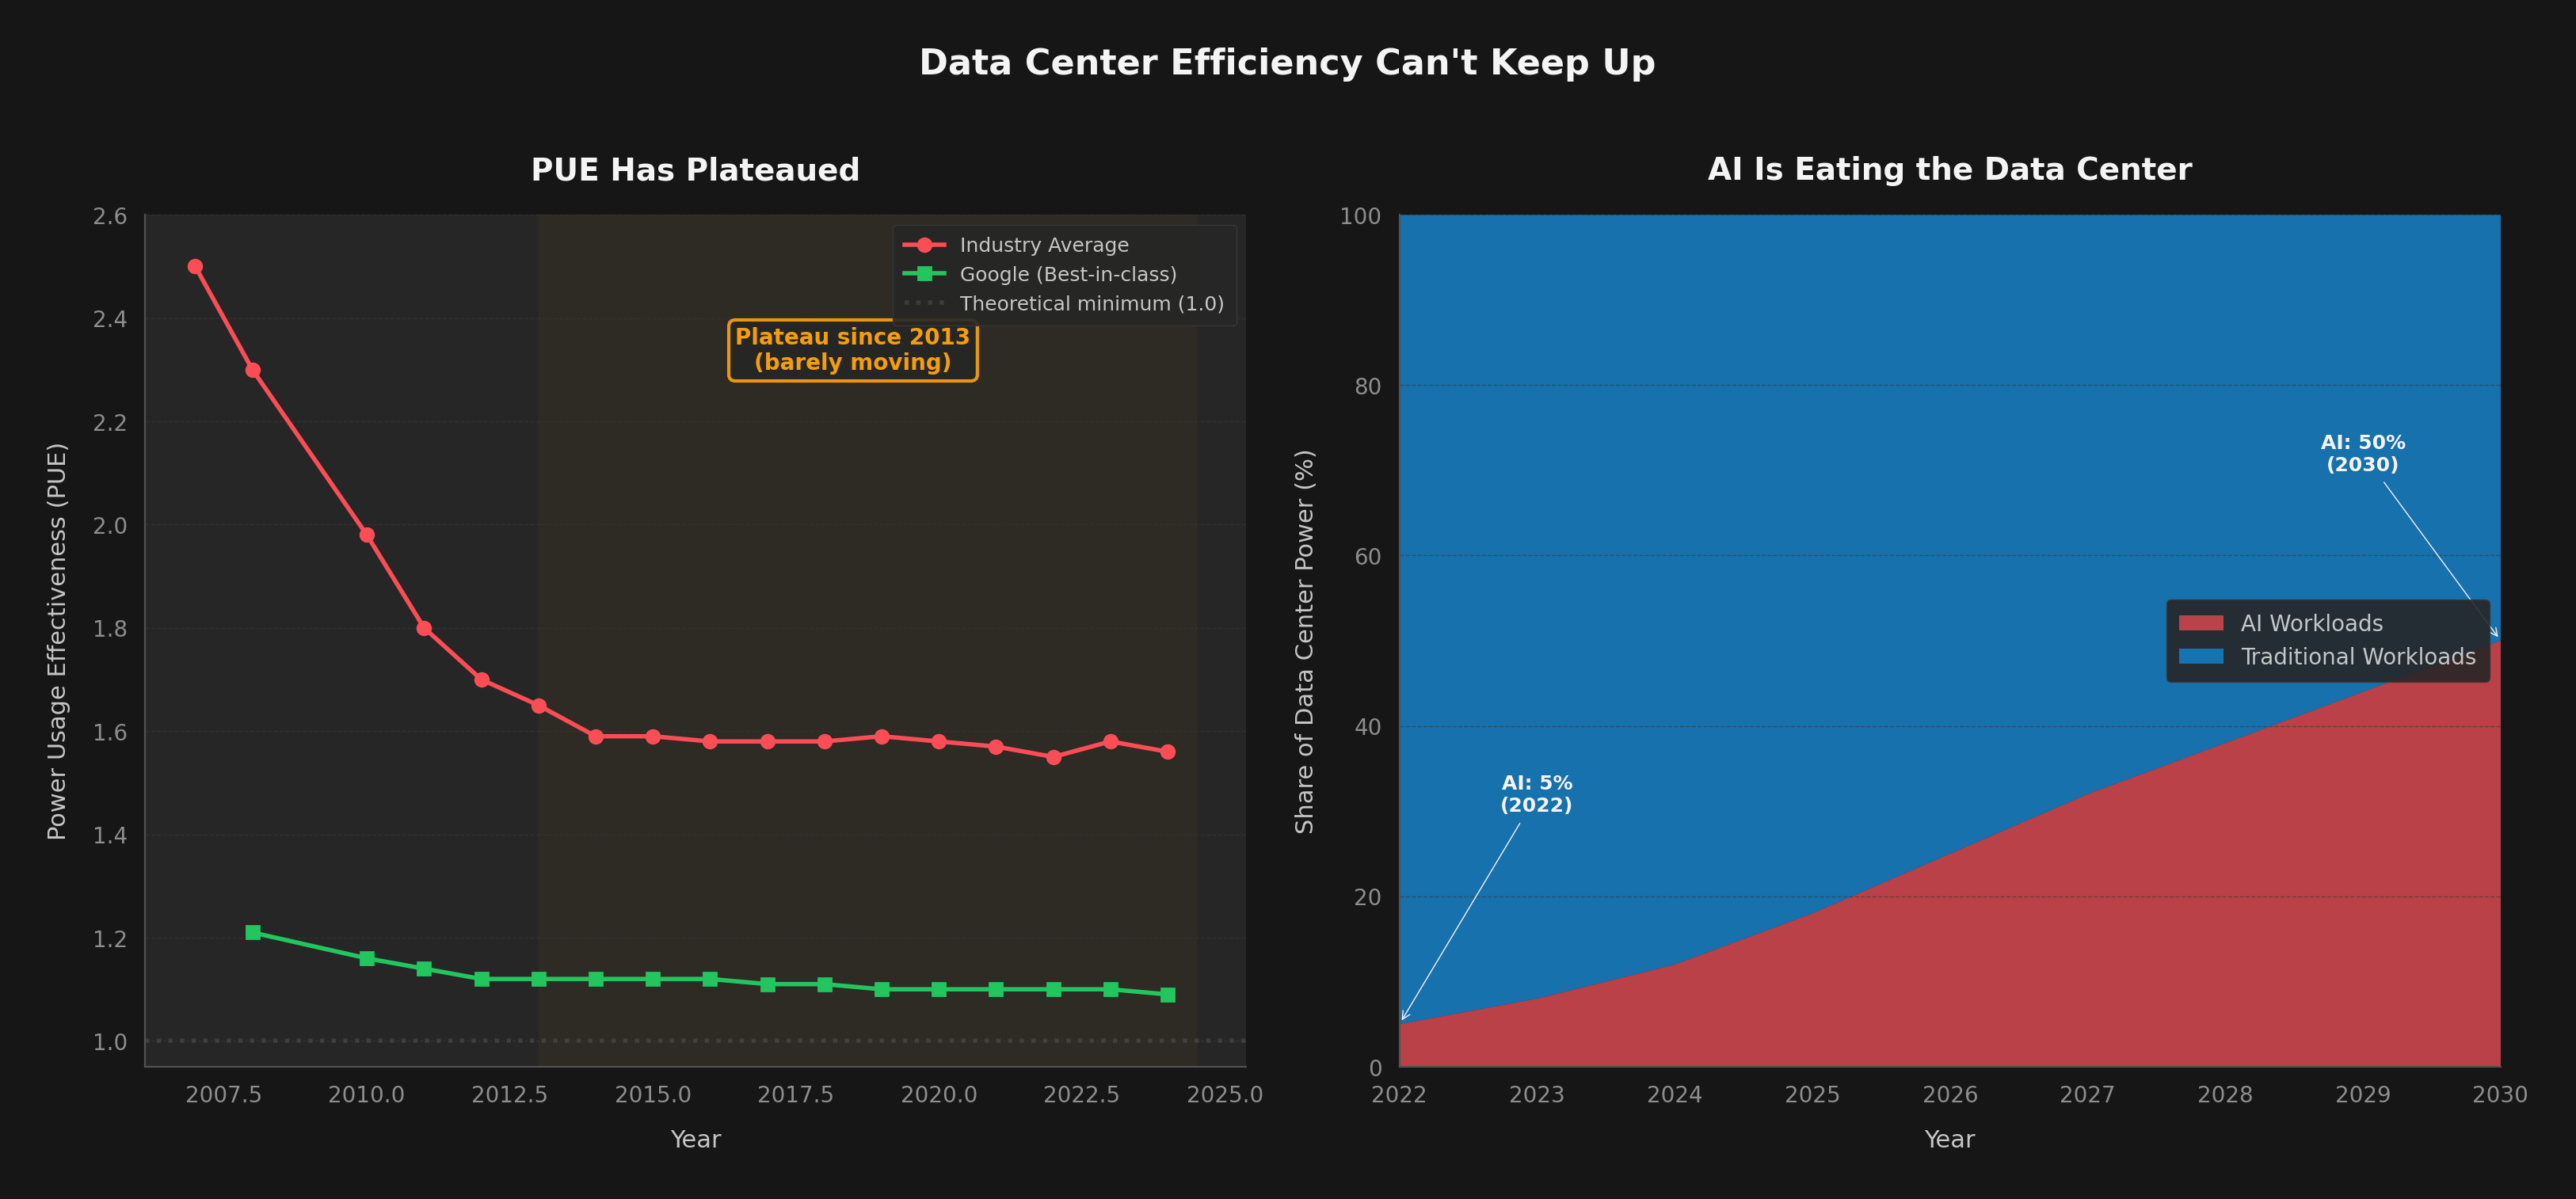
Hardware engineers are doing extraordinary work. GPU silicon improved ~66x in compute per watt over 9 years (including the shift from FP16 to FP4 precision). But that's only part of the story — algorithmic gains (quantization, MoE, distillation) contributed another ~5x, and hyperscaler economies of scale plus competitive pricing pressure added ~3x more. Multiply them together: 66 × 5 × 3 ≈ 1,000x total reduction in the cost to run a token. NVIDIA's Blackwell and Rubin, Google's Ironwood TPU, and AMD's MI355X represent genuine breakthroughs.

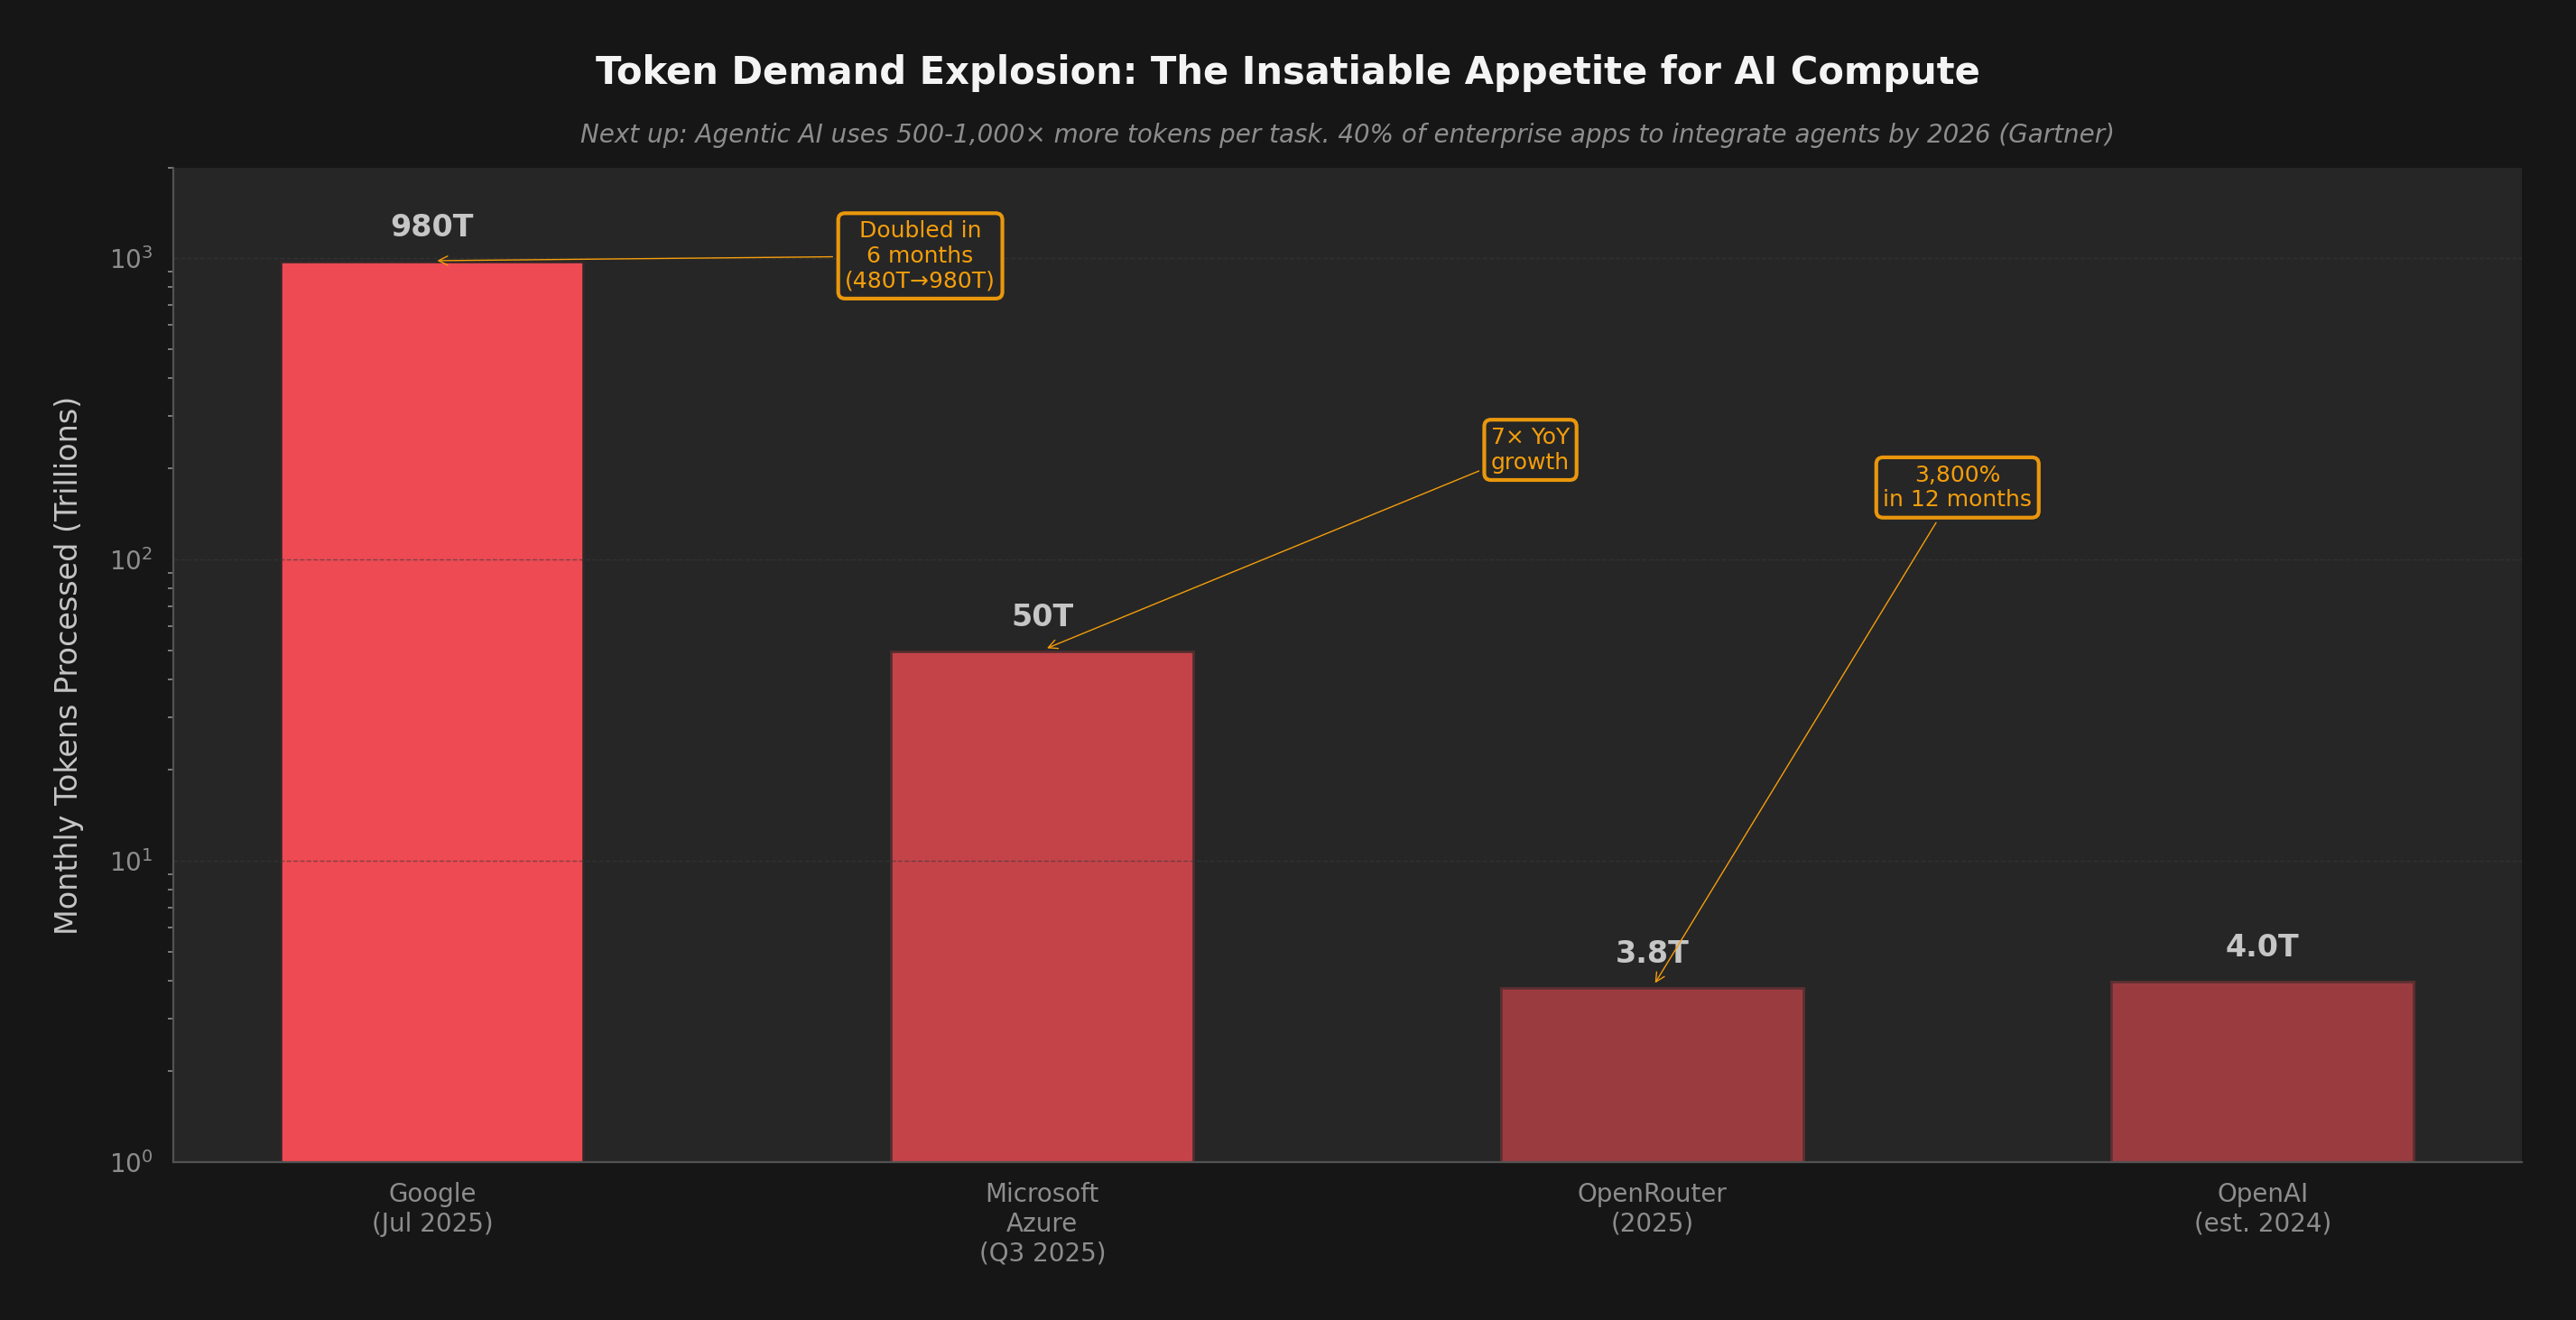
But efficiency alone cannot solve the AI electricity crisis. The historical pattern is unambiguous: every time we make AI cheaper and faster, we use dramatically more of it. That 1,000x cost reduction unleashed 10,000x more demand. The grid feels the net, not the per-unit improvement.

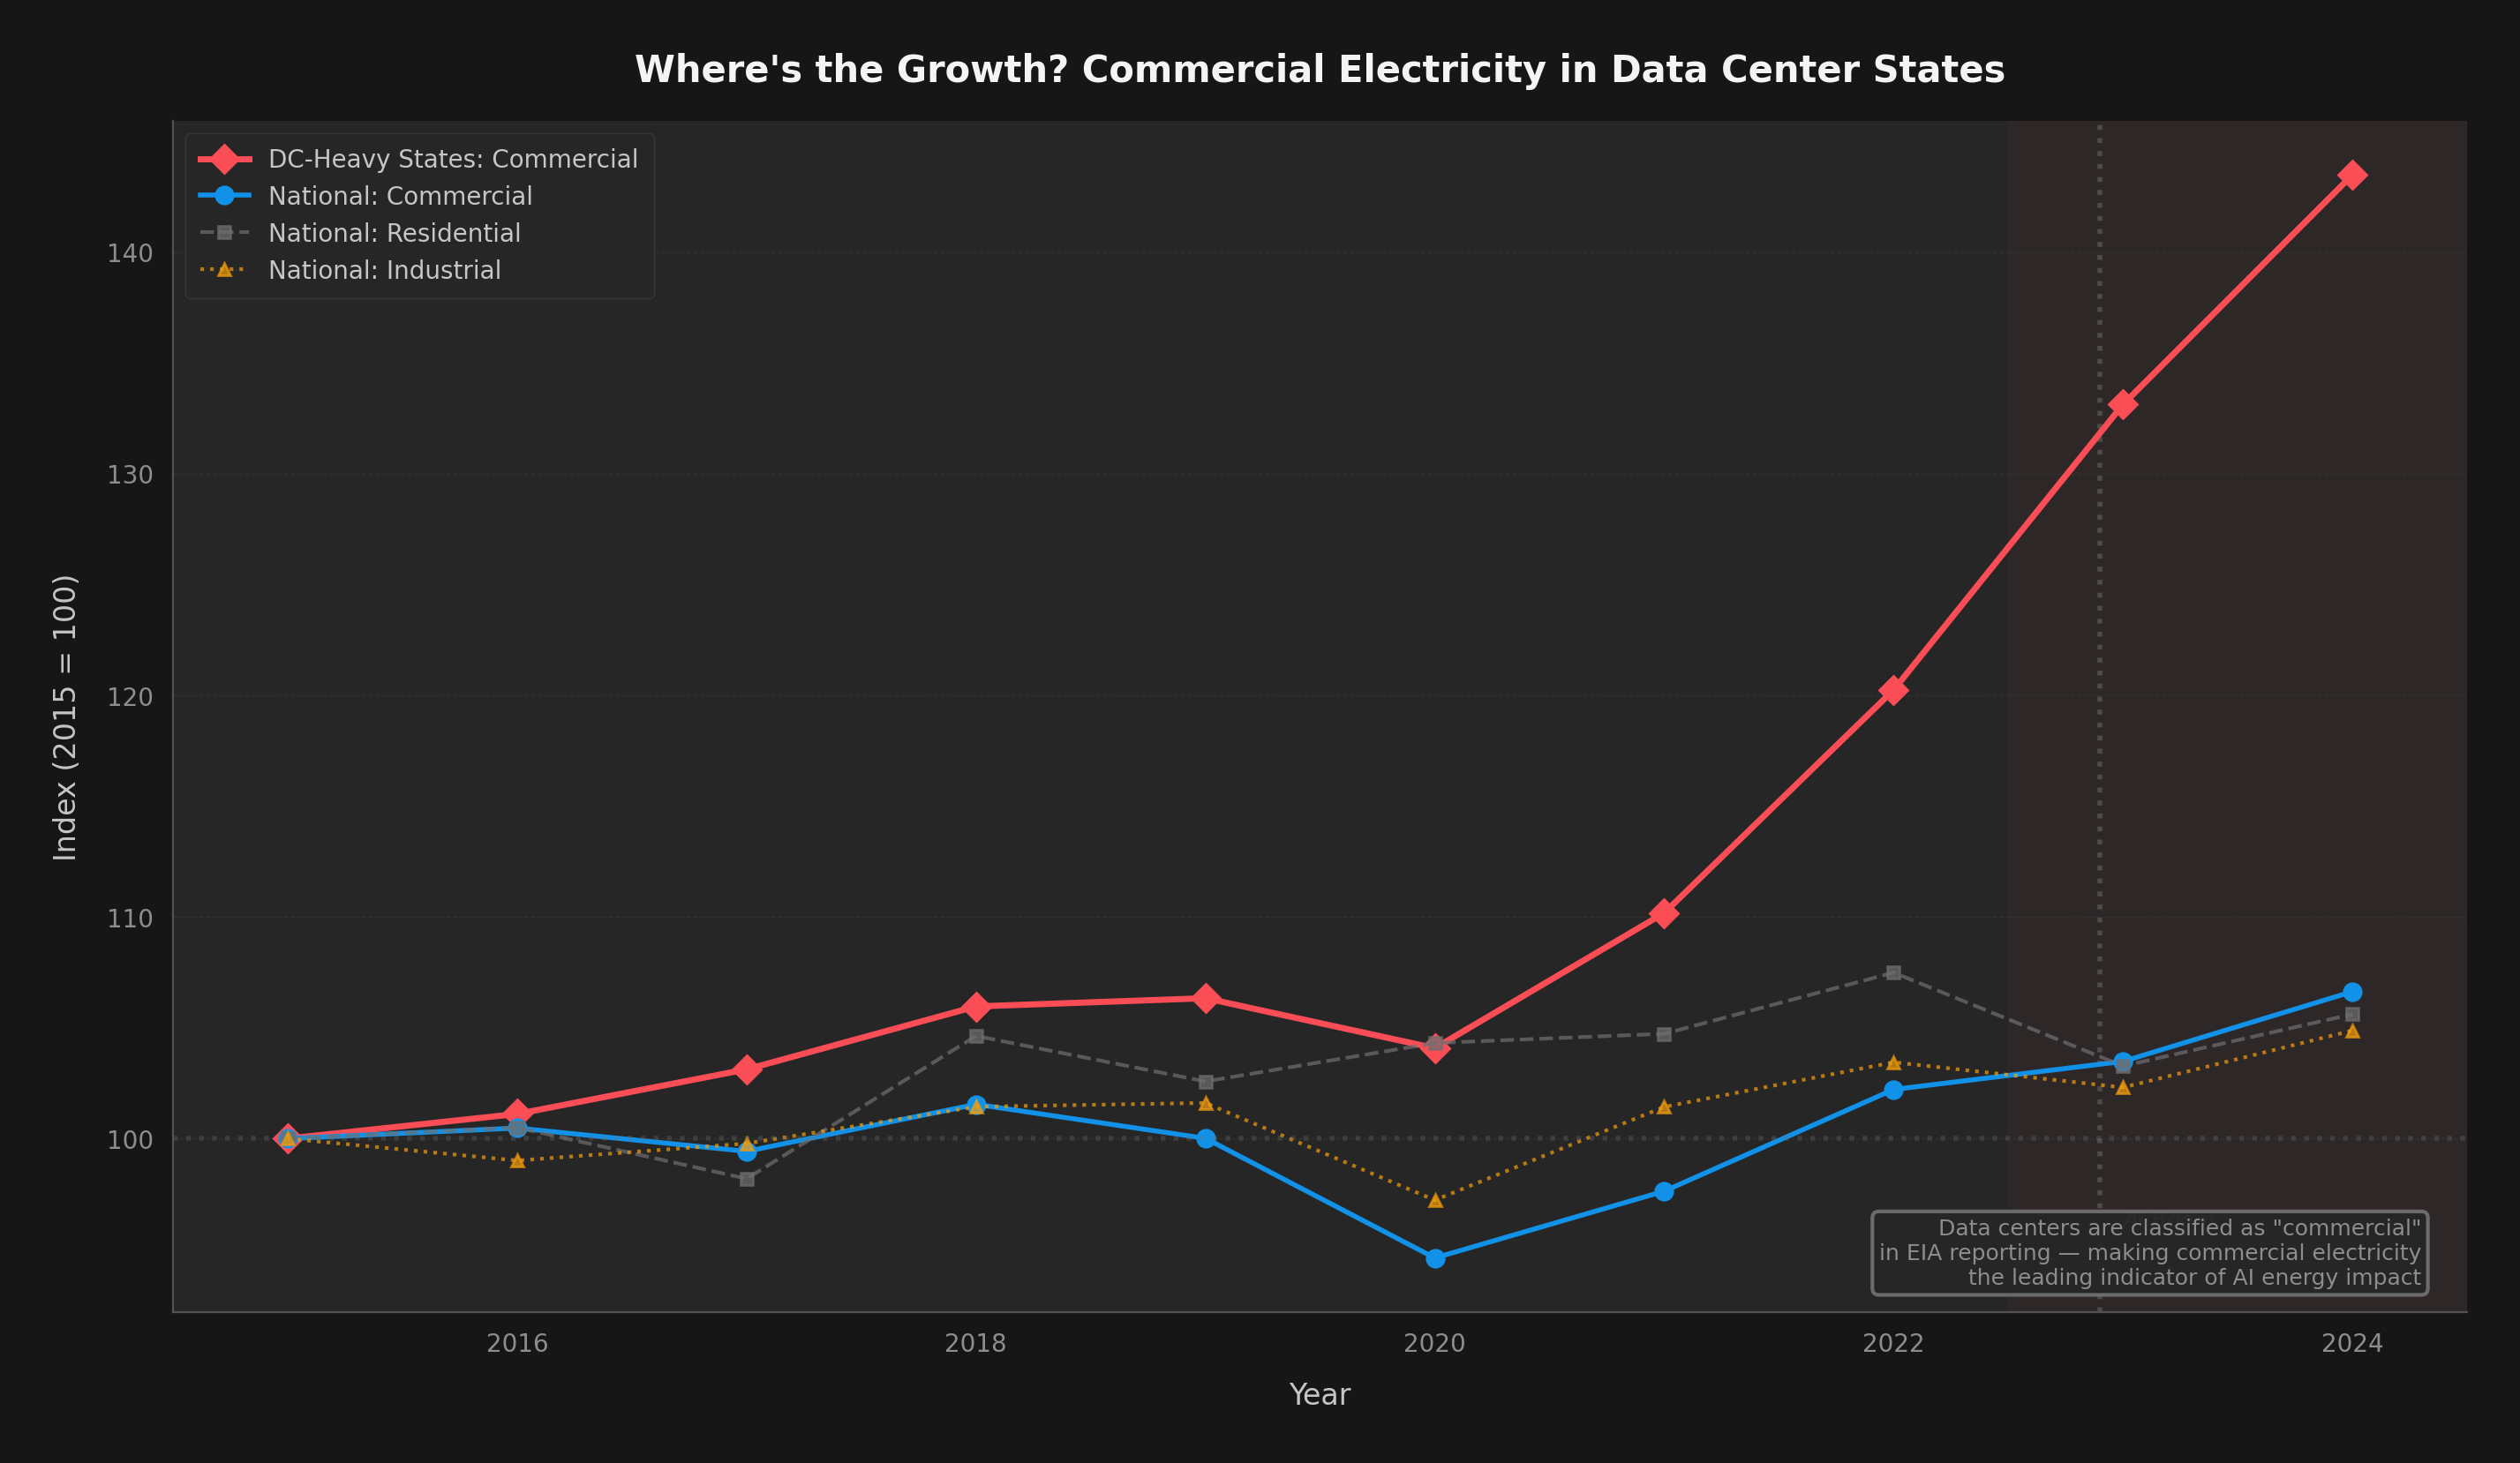
The states where data centers are already concentrated — Virginia, Oregon, Iowa, North Dakota, Nebraska — are living previews of what the rest of the country will face by 2030. Virginia's grid didn't plan for 25% data center load. Neither did anyone else's.

"We are entering a rite of passage, both turbulent and inevitable, which will test who we are as a species."

— Dario Amodei, CEO Anthropic, "The Adolescence of Technology" (January 2026)

The companies that thrive in this environment won't be the ones with the most GPUs. They'll be the ones who understand that intelligence is becoming abundant, but energy is becoming scarce — and plan accordingly.


Note on the 66x figure: This compares V100 FP16 (~0.52 TFLOPS/W) to Rubin FP4 (~27.8 TFLOPS/W, pre-release). The comparison spans both silicon improvements and the evolution from FP16 to FP4 precision formats. Comparing within a single precision format (e.g., FP16 throughout) yields approximately 25-30x. Both framings are valid — real-world AI inference increasingly uses lower-precision formats, so the cross-precision comparison reflects actual deployment gains.

Data Sources

Published February 4, 2026 · Analysis by aictrl.dev

Charts generated from public datasets (EIA, EPRI/DOE, IEA, NVIDIA, Epoch AI). All data sources linked above.