Why Knowledge Graphs Are the Missing Infrastructure Layer for Agentic AI

95% of enterprise AI pilots fail to reach production. The root cause isn't the models — it's the data layer. New research shows knowledge graphs improve LLM accuracy by 3–5x and cut token costs by up to 97%.


The 95% Failure Rate Has a Root Cause

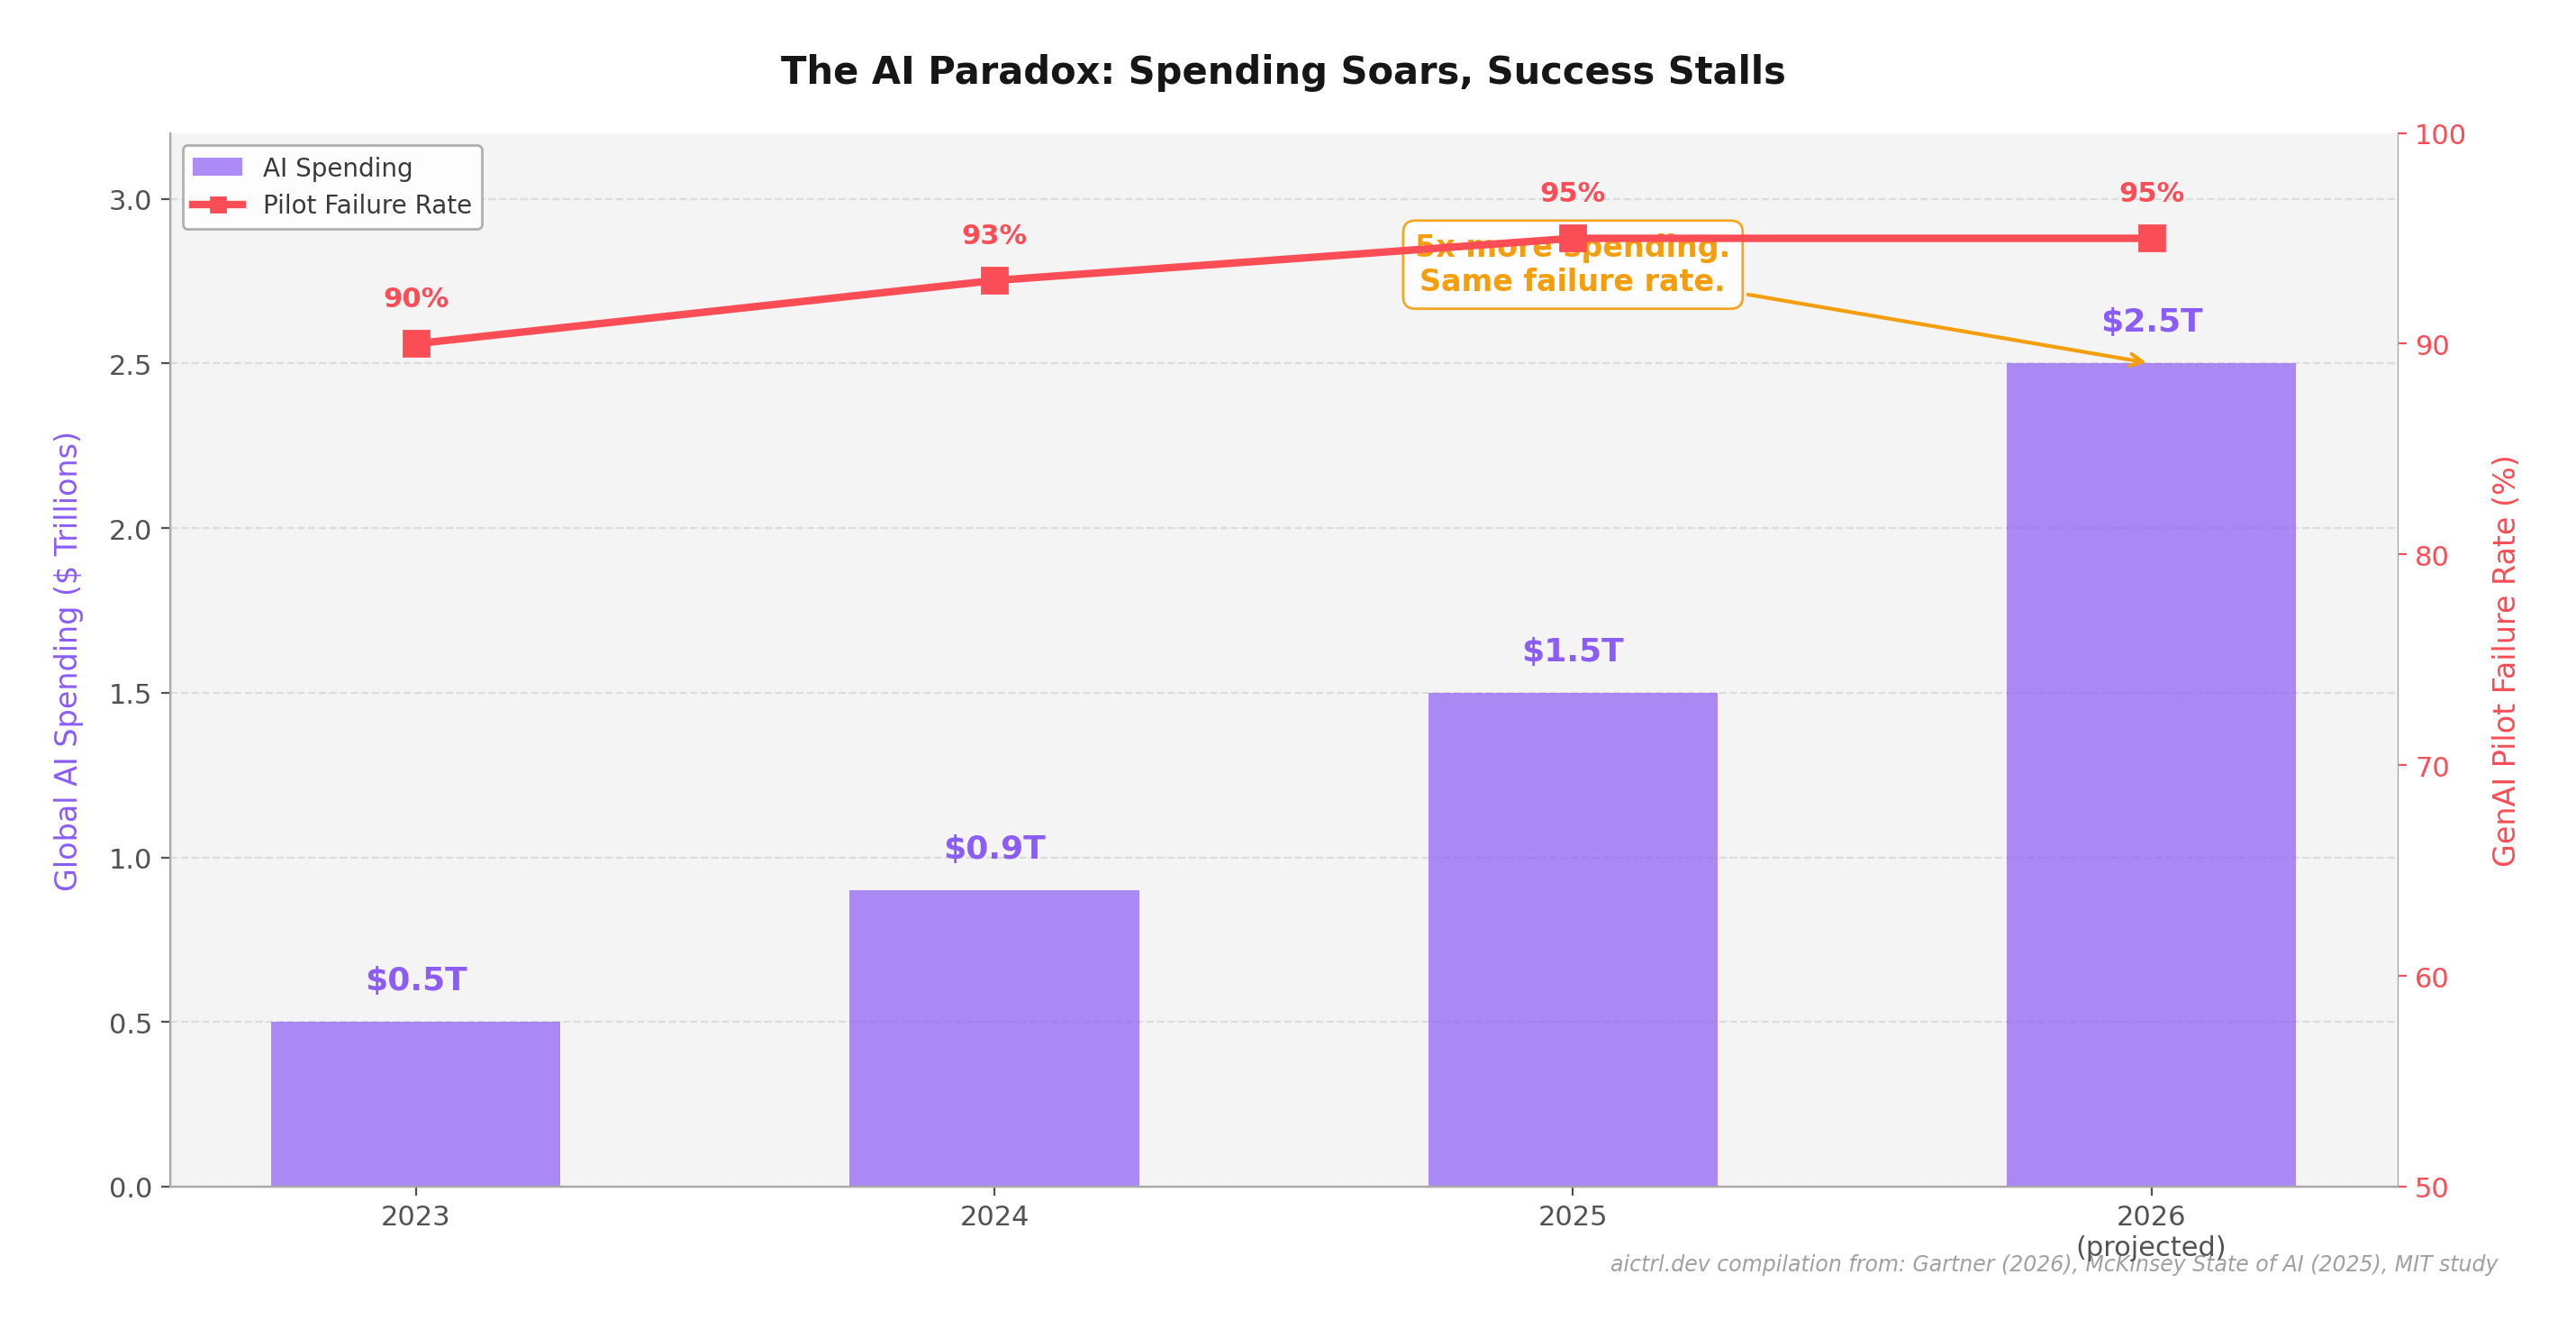
Enterprise AI spending will hit $2.5 trillion in 2026, according to Gartner. That's a 67% increase from 2025. And yet, according to MIT and McKinsey, 95% of GenAI pilot programs still fail to deliver measurable financial returns. Only 39% of organizations report any EBIT impact from AI at all.

Five times the investment. The same failure rate.

Enterprise AI spending growing from $0.5T to $2.5T while pilot failure rate stays at 95%
The AI Paradox. Global AI spending has 5x'd since 2023, but the percentage of pilots reaching production hasn't budged. The bottleneck isn't compute or model capability — it's data readiness.

The common explanation is that organizations need "better prompts" or "more training data." But McKinsey's 2025 State of AI survey tells a different story: data integration consistently ranks as the top barrier to scaling AI, with the majority of organizations struggling to connect disparate data sources. Not model selection. Not prompt engineering. Data.

"Context engineering is the delicate art and science of filling the context window with just the right information for the next step."

— Andrej Karpathy, co-founder of OpenAI, popularizing the term in 2025

Karpathy's framing cuts to the core: the context window is the model's working memory. If you fill it with unstructured noise, you get hallucinations. If you fill it with precisely the right structured information, you get reliable results. The difference between a failed pilot and a production system often comes down to how well you engineer that context.

Knowledge graphs are how you do it.


The Accuracy Revolution: When Structure Meets Intelligence

The evidence is no longer theoretical. Across multiple domains, peer-reviewed research shows that adding a knowledge graph or semantic layer between raw data and an LLM delivers dramatic, measurable accuracy improvements.

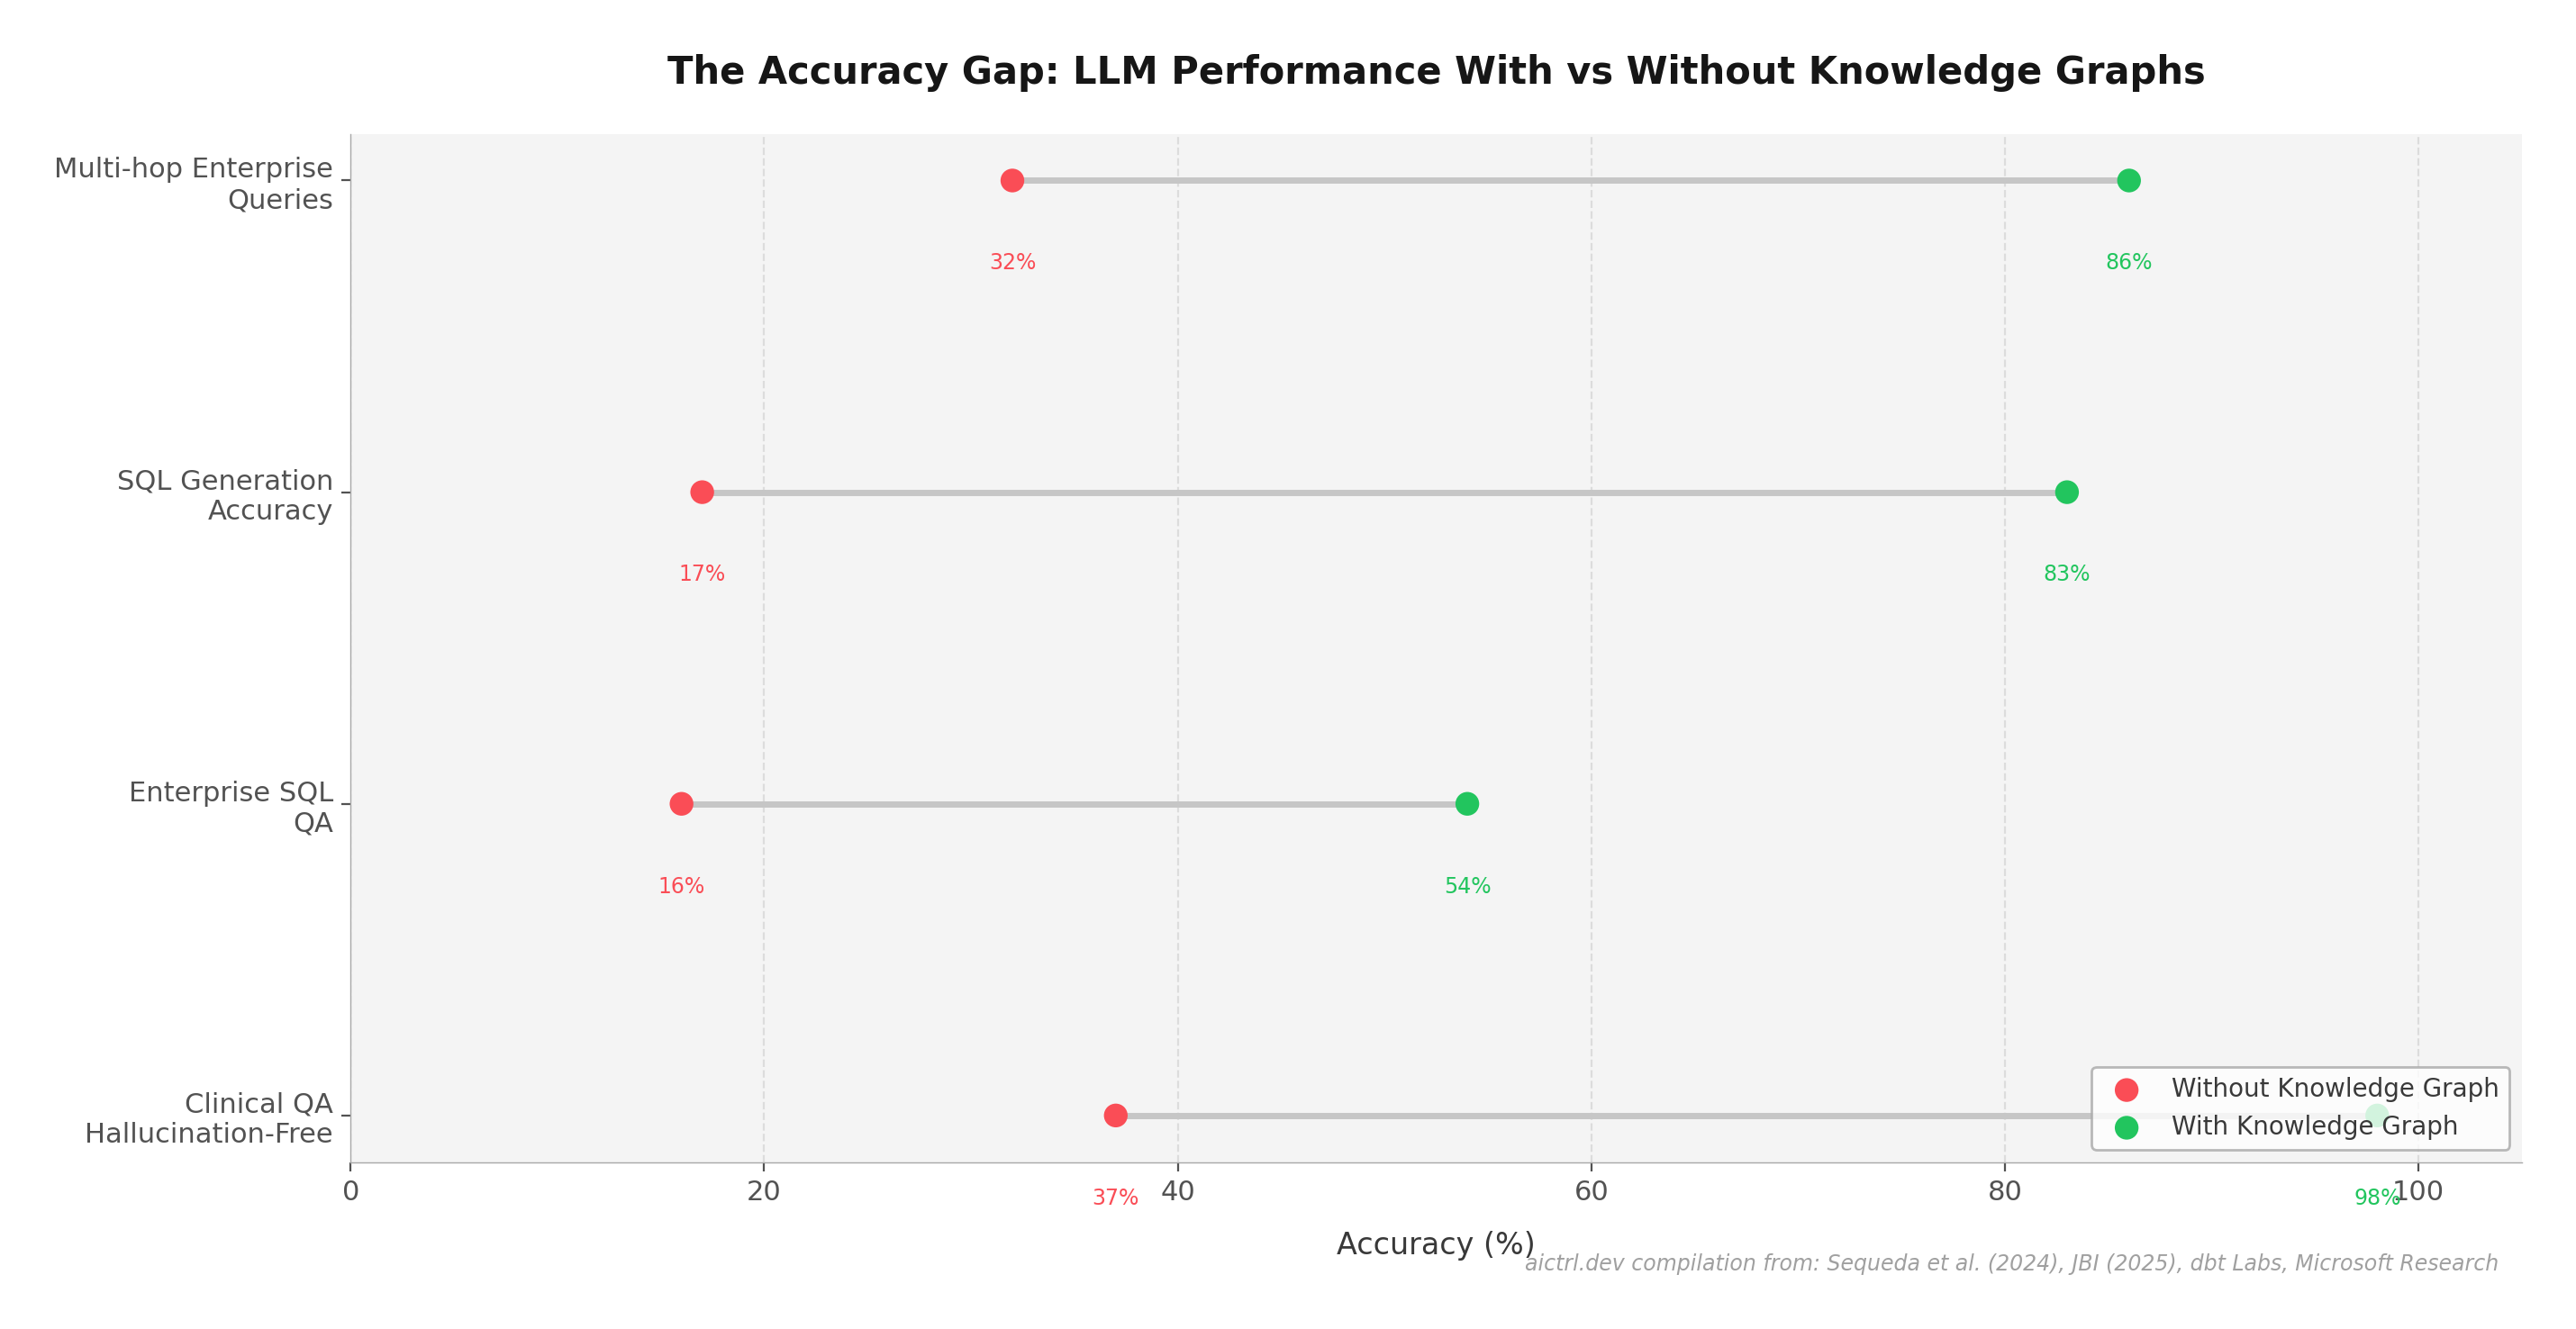
Dumbbell chart showing LLM accuracy improvements with knowledge graphs across 4 domains
The Accuracy Gap. LLM performance with vs. without knowledge graphs across four enterprise domains. Every domain shows at least a 2x improvement, with clinical QA reaching near-perfect accuracy.

The numbers are striking:

3.4x
Enterprise SQL QA accuracy improvement with KG (16% → 54%)
Sequeda et al., GRADES-NDA 2024
63% → 1.7%
Hallucination rate reduction with ontology-grounded KG-RAG
Journal of Biomedical Informatics, 2025
17% → 83%
SQL generation accuracy when LLMs query through a semantic layer
dbt Labs, 2024
86% vs 32%
Multi-hop enterprise query accuracy: GraphRAG vs baseline RAG
Microsoft Research GraphRAG 1.0, 2025

The pattern is consistent: when LLMs operate against structured, semantically rich data instead of raw text, accuracy doesn't improve incrementally — it transforms categorically.

"Nearly every AI problem is a data problem — more specifically, a problem of understanding how things connect across disparate systems."

— Emil Eifrem, CEO and co-founder, Neo4j

But Graphs Don't Win Everywhere

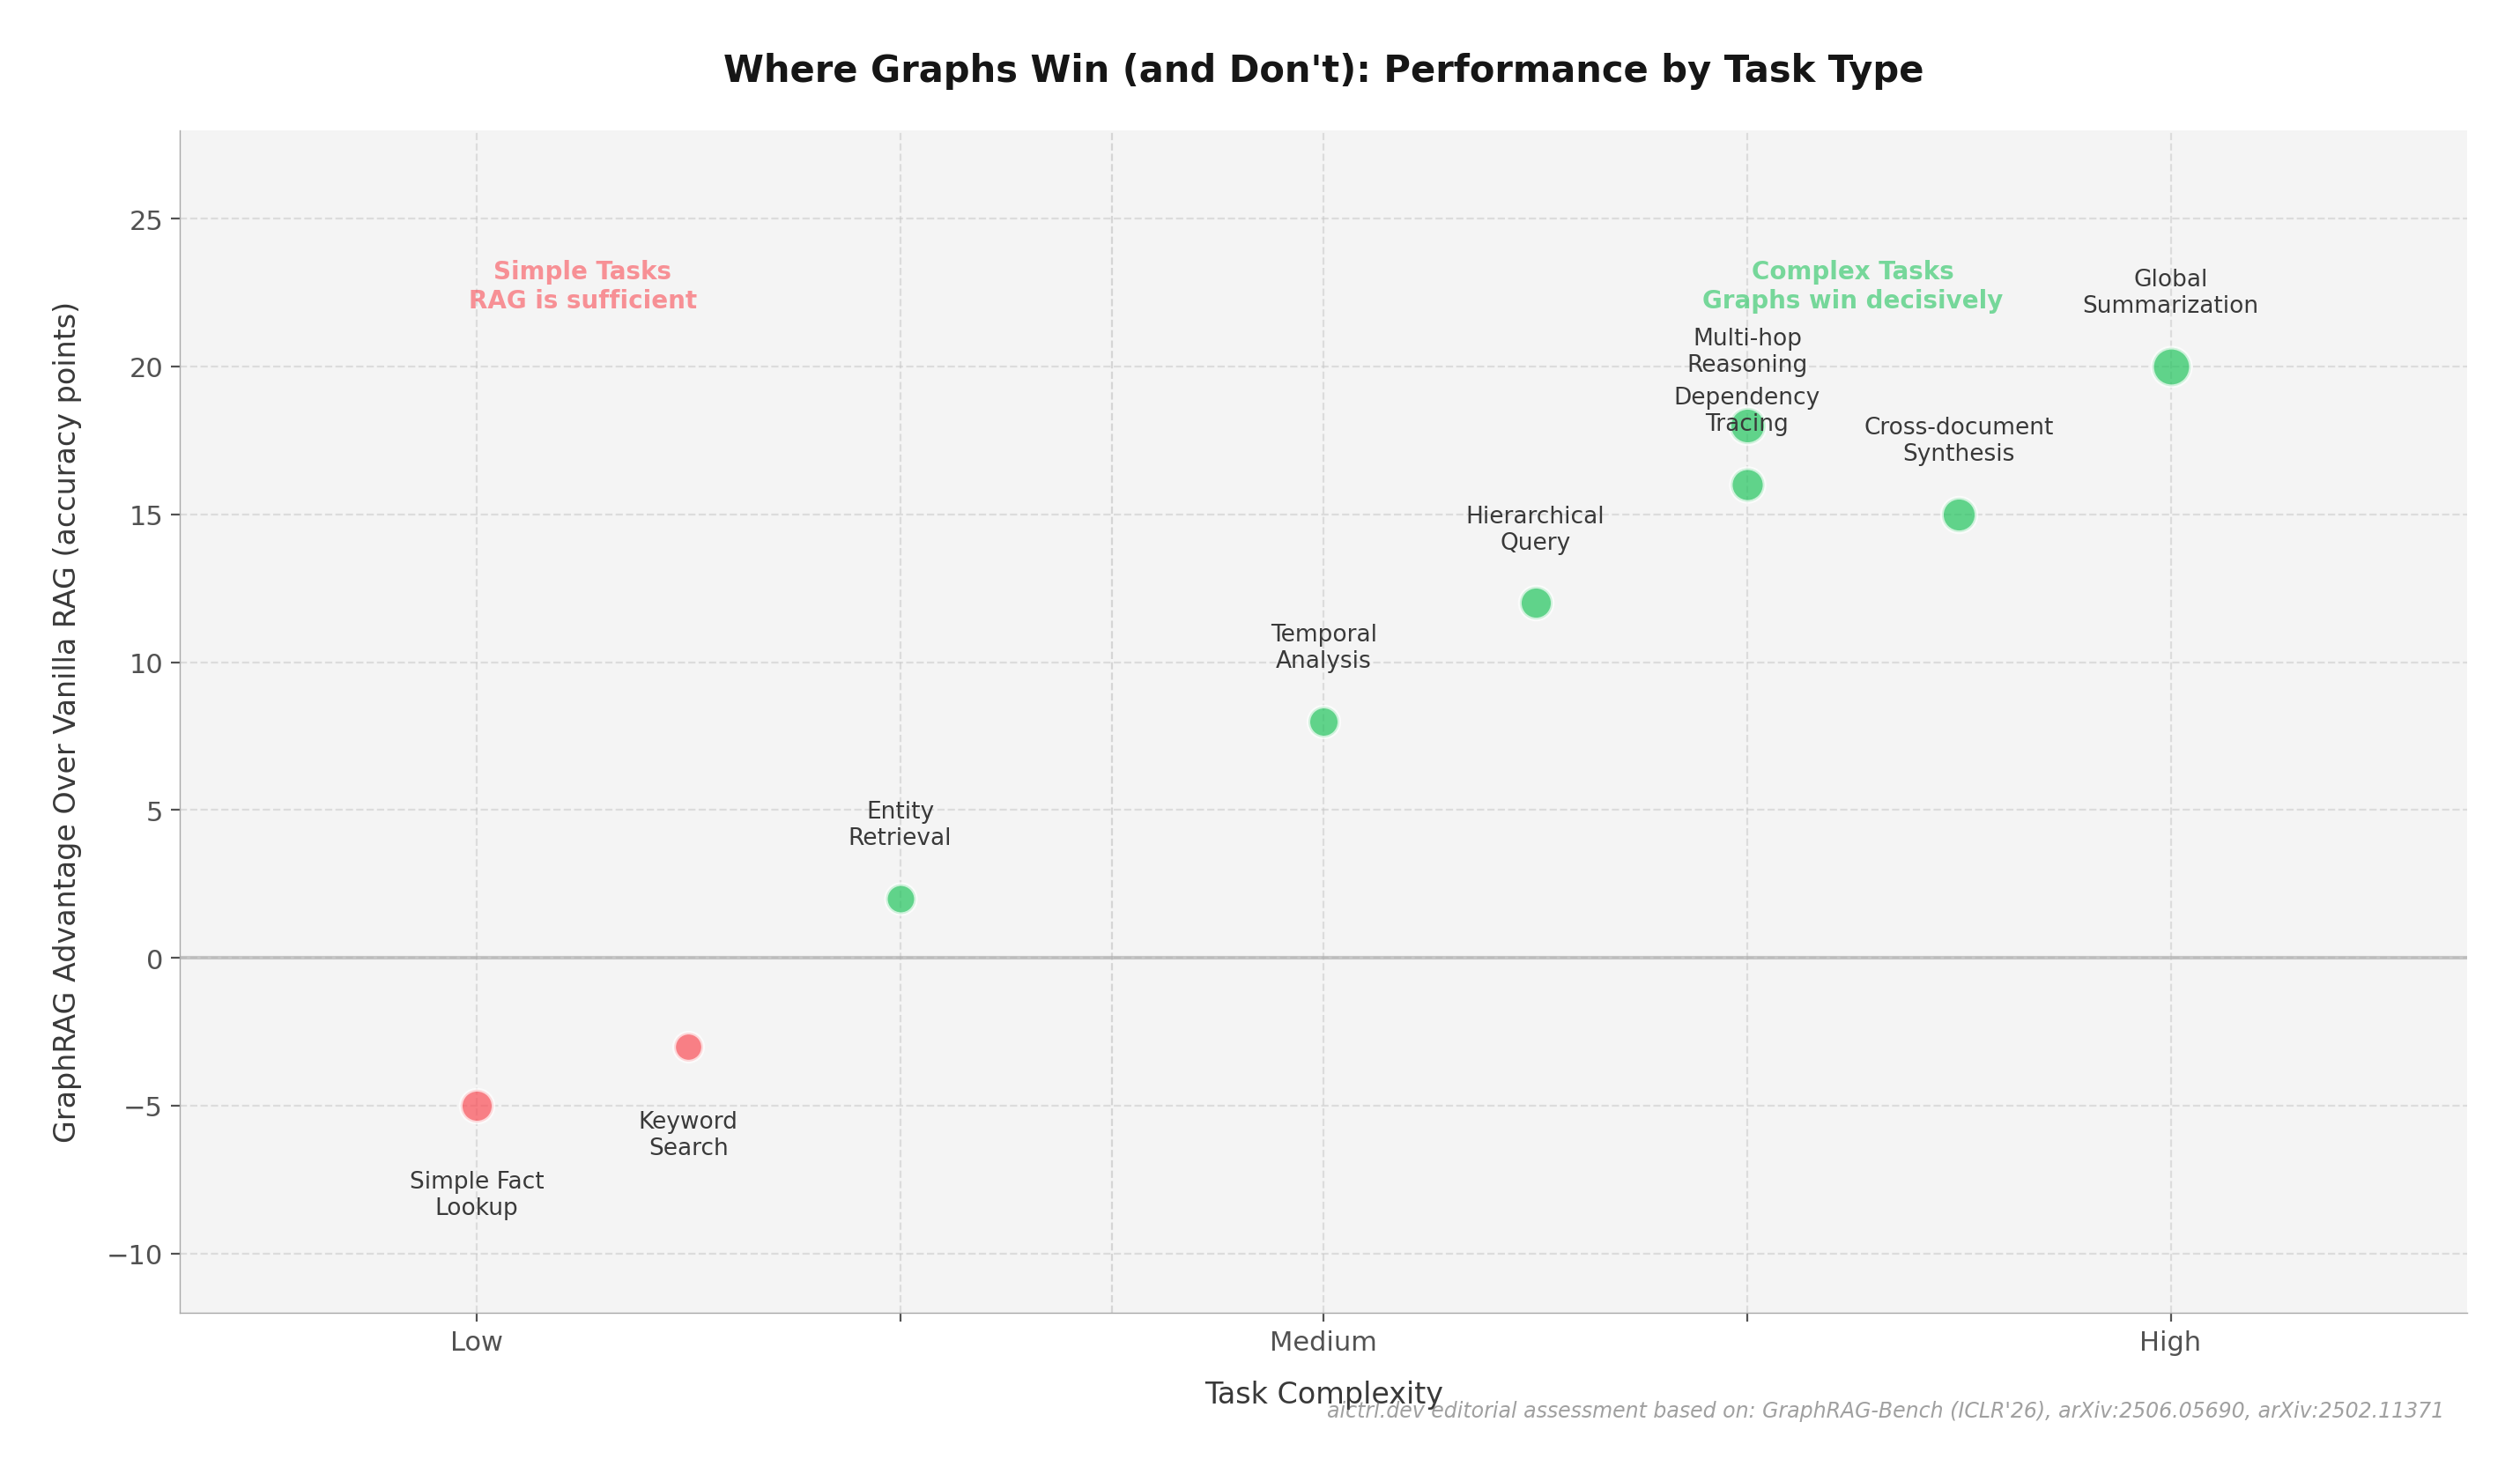
Intellectual honesty matters. The GraphRAG-Bench benchmark, accepted at ICLR 2026, provides the most rigorous evaluation to date. Its finding: GraphRAG wins decisively on complex, multi-hop reasoning tasks — often by 5–20 accuracy points — but frequently underperforms vanilla vector RAG on simple single-hop lookups.

Scatter chart showing GraphRAG advantage by task complexity
Where Graphs Win (and Don't). Graph-based retrieval excels at multi-hop reasoning, dependency tracing, and global summarization. For simple keyword lookups, traditional RAG is faster and cheaper. The engineering skill is knowing which structure to apply when.

This isn't a weakness — it's a design guide. If your AI agents only do simple lookups, you don't need a knowledge graph. But enterprise workflows — root cause analysis, impact assessment, cross-team dependency tracing, compliance auditing — are inherently multi-hop. That's where graphs are transformative.

The Enterprise Sweet Spot

Knowledge graphs deliver the highest ROI on tasks that require understanding relationships: "What depends on this service?", "Which teams are affected by this change?", "What's the full lineage of this data point?" These are exactly the questions enterprise AI agents need to answer reliably.


The Token Tax: Why Unstructured Context Is Burning Your Budget

Every token your AI agent processes costs money. At enterprise scale — thousands of queries per day across dozens of agents — the token bill becomes a line item that finance notices. And the uncomfortable truth is: most of those tokens are wasted on unstructured noise.

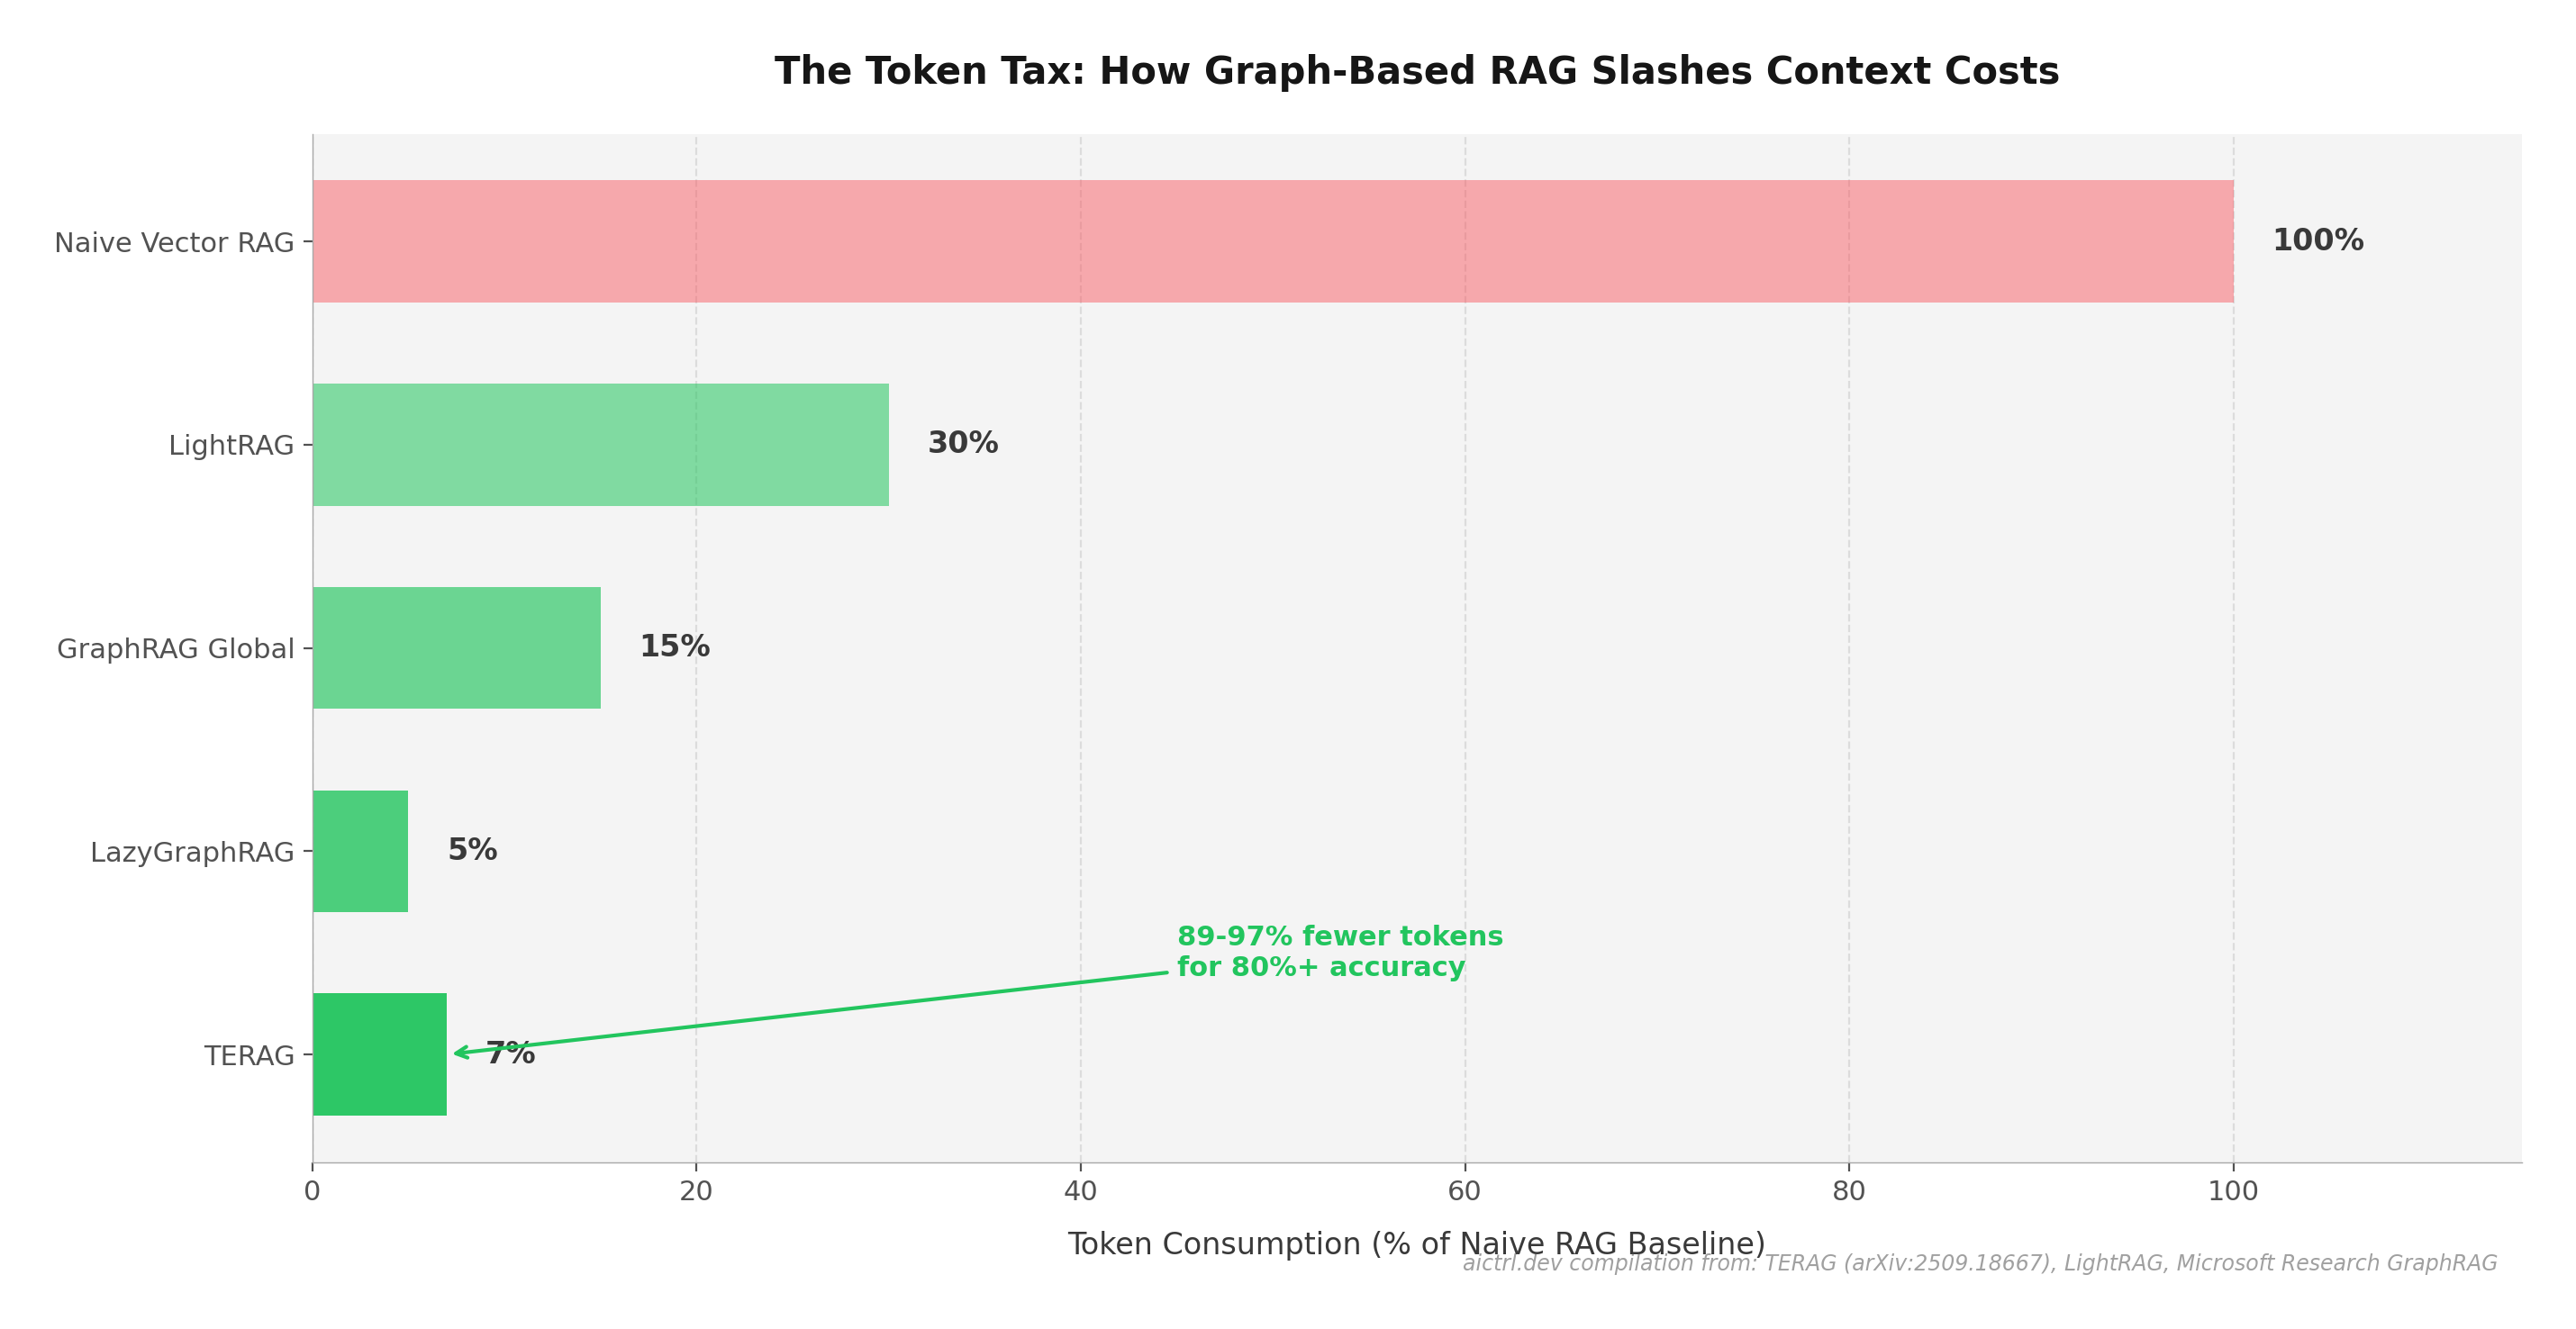
A 2025 ACL workshop paper demonstrated that graph-based retrieval achieves an 80% decrease in token usage compared to conventional RAG methods. The TERAG framework took this further: 3–11% of the tokens used by naive graph RAG methods, while maintaining over 80% accuracy.

Horizontal bar chart showing token consumption decreasing from 100% (naive RAG) to 5-7% (TERAG/LazyGraphRAG)
The Token Tax. Graph-based approaches slash token consumption by 80–97% compared to naive vector RAG. TERAG and LazyGraphRAG achieve the lowest costs while maintaining competitive accuracy on complex queries.

The implications are financial. Consider the numbers:

97%
Fewer tokens at root-level summary vs traditional RAG
Microsoft GraphRAG
$37K/yr
Savings using LightRAG + local model vs standard OpenAI RAG
Practitioner case study
4x
Token cost variation from serialization format alone (List-of-Edges vs JSON-LD)
KG-LLM-Bench, NAACL 2025

Perhaps most remarkably, a February 2026 paper introduced SOG (Structure of Graph), which maps an entire graph topology into a single LLM token. One token. For a complete structural description that would otherwise consume thousands of tokens as natural language.

Microsoft's LazyGraphRAG (June 2025) addressed the other side of the cost equation: indexing. Full GraphRAG's upfront cost of building the knowledge graph was prohibitively expensive. LazyGraphRAG defers community summarization to query time, reducing indexing costs to 0.1% of full GraphRAG — making graph-augmented RAG cost-competitive with simple vector search for the first time.

The CFO Argument

If your organization runs 10,000 agent queries per day at an average of 5,000 tokens per query, an 80% reduction in token consumption saves 40 million tokens per day. At current API pricing, that's tens of thousands of dollars per month. Knowledge graphs pay for themselves in token savings alone.


The Regulatory Clock Is Ticking

On August 2, 2026, the EU AI Act's requirements for high-risk AI systems become enforceable. Article 10 mandates that providers maintain full data lineage documentation — auditable records of data origins, preprocessing steps, transformations, and quality assessments. Annex IV requires system design records, testing methodologies, and performance benchmarks.

This isn't optional guidance. It's law, with penalties.

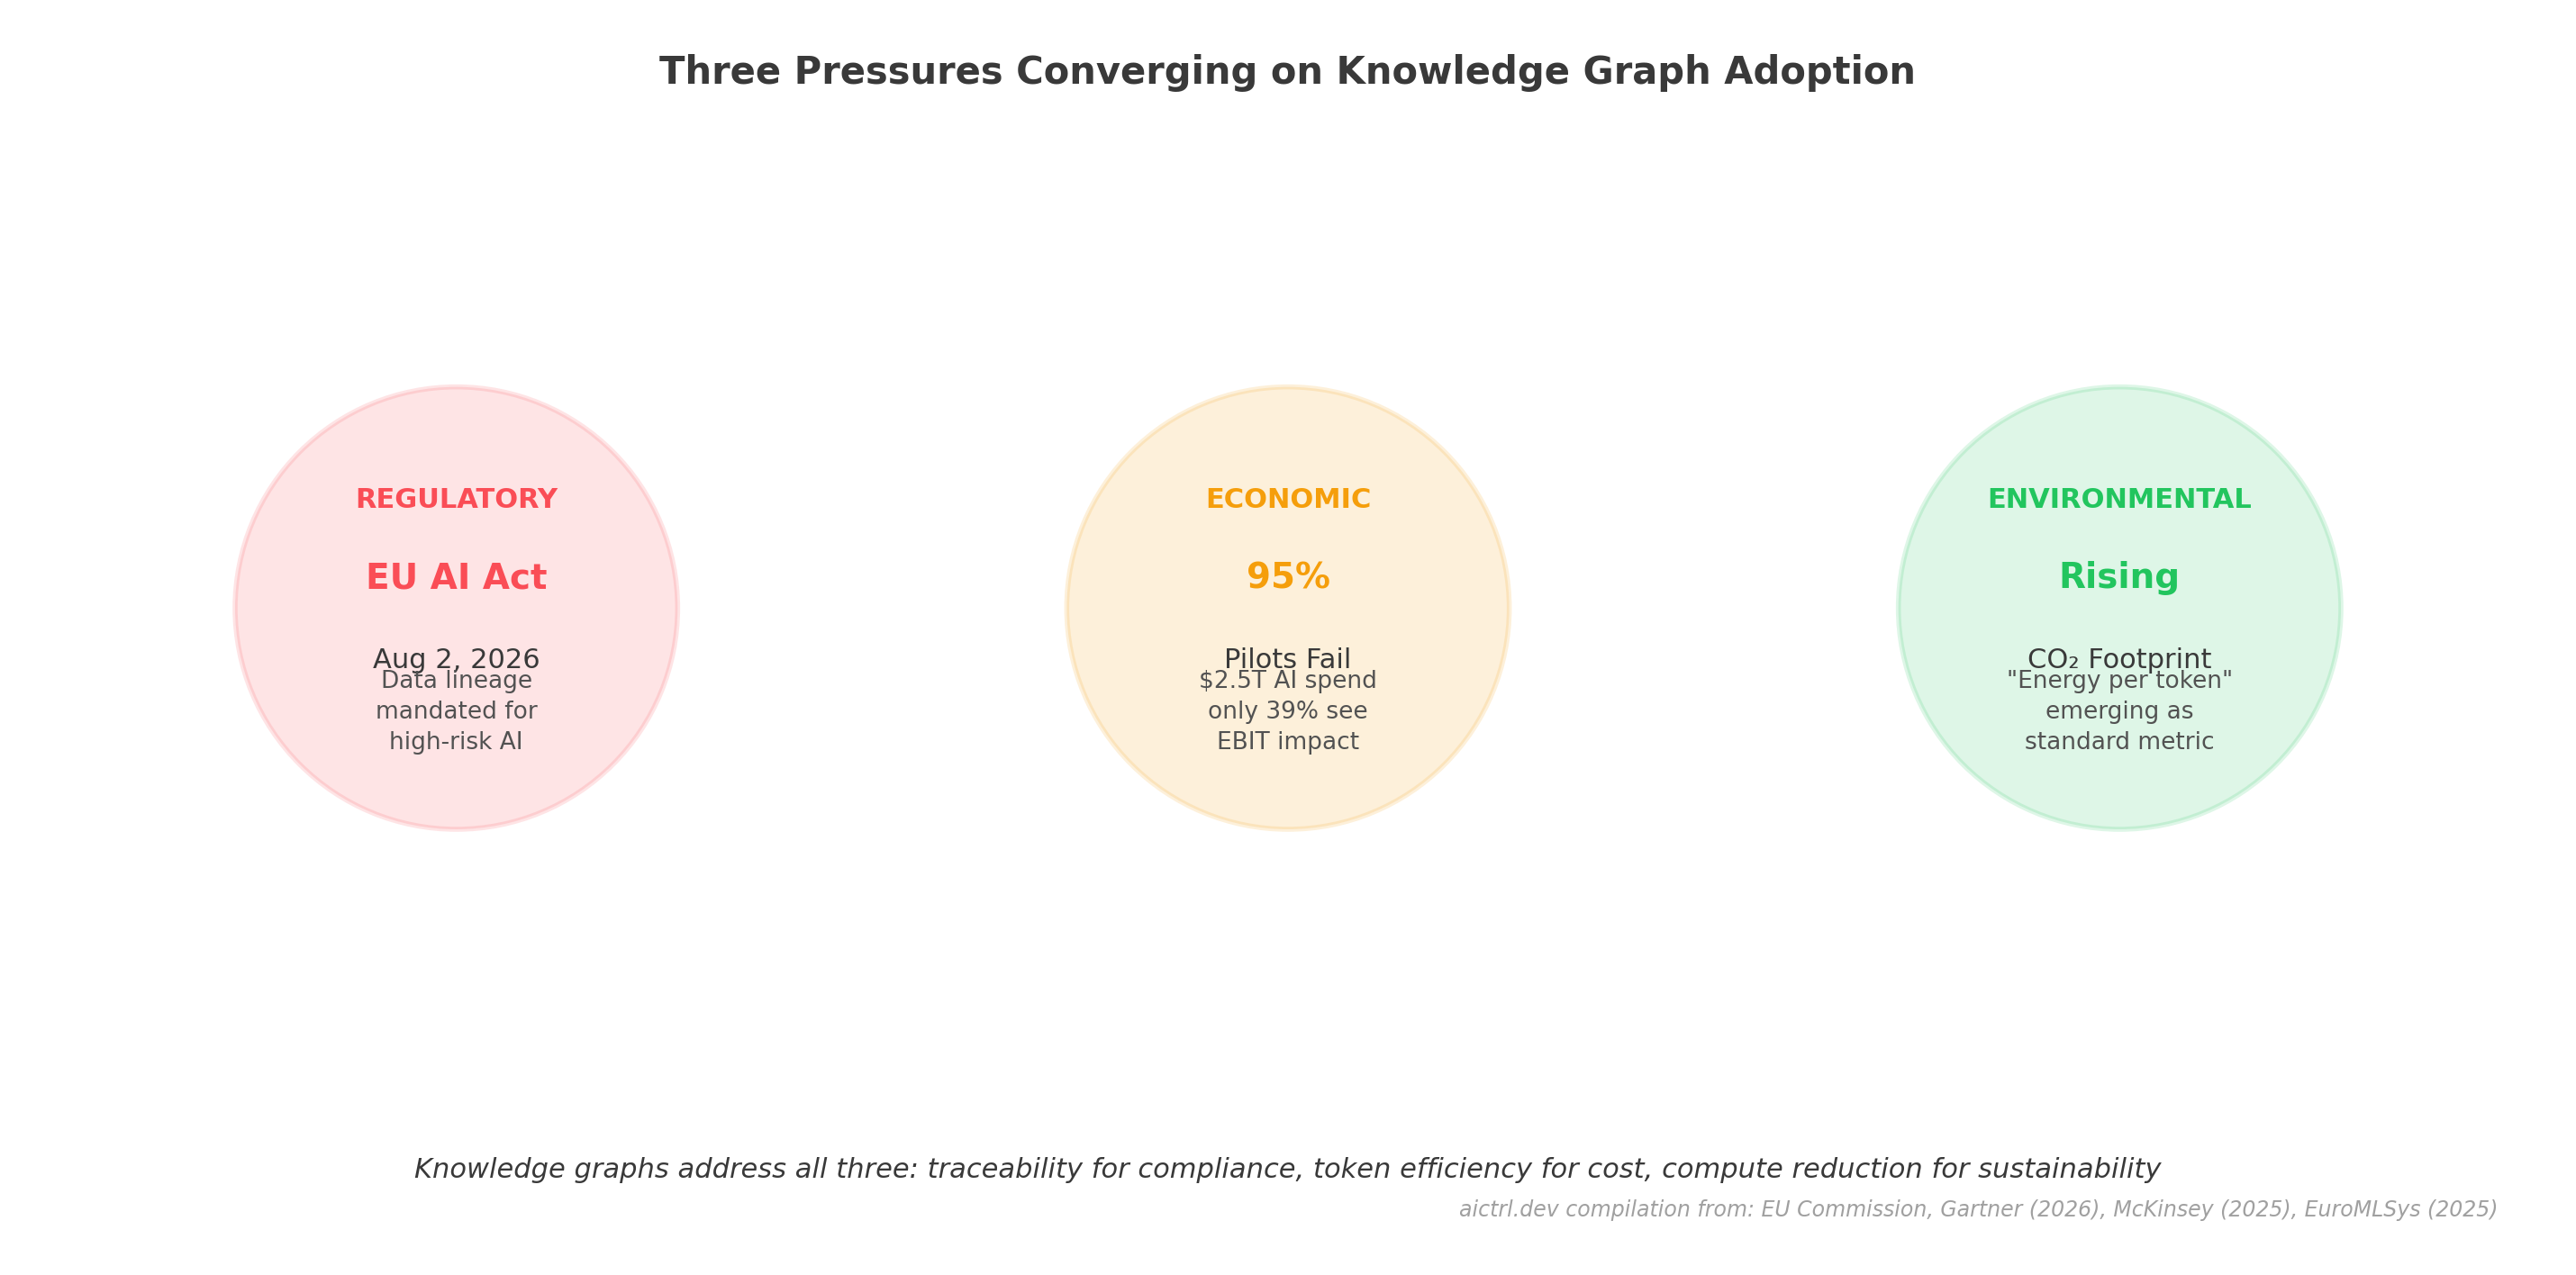
Three pressures converging: Regulatory (EU AI Act), Economic (95% pilot failure), Environmental (rising CO2 footprint)
Three Pressures Converging. Regulatory mandates, economic inefficiency, and environmental sustainability are simultaneously driving enterprise adoption of knowledge graphs as foundational AI infrastructure.

Knowledge graphs are architecturally suited to this challenge. They don't just store data — they store how data connects, where it came from, and how it was transformed. A 2025 Springer paper demonstrated an open knowledge graph implementing the Trustworthy AI Requirements (TAIR) ontology that maps legal obligations directly to technical compliance artifacts.

The environmental pressure adds urgency. AI inference is estimated to consume a rapidly growing share of global data center electricity, with industry analyses projecting tens of millions of tons of CO2 from AI workloads. A new metric — "energy per token" — is emerging as the standard unit for measuring AI inference sustainability (EuroMLSys 2025). Fewer tokens means quantifiably less energy, less CO2, less water.

The Compliance Window

Enterprises have less than 6 months to deploy data lineage and traceability infrastructure for high-risk AI systems. The AI governance market is growing at 28%+ CAGR toward $492M in 2026 (OvalEdge). If your AI systems touch regulated domains — finance, healthcare, HR — knowledge graph-style traceability is becoming a legal requirement, not a nice-to-have.


From Code to Context: Building a Knowledge Graph from Engineering Data

Theory is interesting. Practice is what ships. Let's look at how a knowledge graph is actually constructed from real engineering data — the kind of data every software team already has: git repositories, issue trackers, and code itself.

At aictrl, we build a knowledge graph from engineering artifacts using a five-phase pipeline that transforms raw code, git history, and GitHub issues into a queryable graph of entities and relationships.

From Raw Data to Knowledge Graph: The 5-Phase Pipeline SOURCE DATA .ts / .tsx files TypeScript source code interfaces{} Type definitions file paths Directory structure git log 6 months of history GitHub Issues PHASE 1 Code Graph (AST) File, Function, Class, Interface PHASE 2 Domain Ontology DomainEntity, Field, Enum PHASE 3 Stack Topology StackLayer, IN_LAYER, roles PHASE 4 Git History Mining churn, CO_CHANGES, authors PHASE 5 GitHub Issues Issue nodes, AFFECTS edges KNOWLEDGE GRAPH (Neo4j) File Func Class Domain Entity Field Enum Stack Layer Issue Repo CONTAINS IN_LAYER MANAGES HAS_FIELD AFFECTS CO_CHANGES 25+ node types · 30+ edge types · Incrementally rebuilt on every push
The aictrl knowledge graph pipeline: five phases transform raw engineering data into a connected graph of code, domain models, architecture, history, and issues.

What Each Phase Produces

Phase 1 — Code Graph. The TypeScript compiler API parses every .ts and .tsx file, extracting File, Function, Class, and Interface nodes. Edges capture IMPORTS, CALLS, CONTAINS, EXTENDS, and IMPLEMENTS relationships. Each file is classified by category (server, UI, test) and role (api_route, mcp_tool, service, ui_component).

Phase 2 — Domain Ontology. Heuristic analysis of exported interfaces identifies business entities and extracts their fields, types, and relationships. A DomainField ending in Id becomes a BELONGS_TO edge. Enums with status-like values get STATE_TRANSITION edges. The result is an automatically generated domain model.

Phase 3 — Stack Topology. Files are mapped to configurable architectural layers (database, API, UI, test) via IN_LAYER edges. Cross-cutting relationships emerge: MANAGES (which service writes an entity), SERVES (which API exposes it), DISPLAYS (which UI component renders it).

Phase 4 — Git History. Six months of git log data produces per-file churn metrics, authorship records, and — critically — CO_CHANGES edges: weighted connections between files that change together. This reveals hidden coupling that no static analysis can detect.

Phase 5 — GitHub Issues. Issues are synced as nodes and linked to code files via AFFECTS edges, scored by relevance. An agent can now ask: "Which files does issue #247 affect?" and get a precise, weighted answer instead of searching through text.

Before: Raw Text Context
~5,200 tokens
File: server/services/epic-service.ts
Lines: 1-342
import { Firestore } from '@google-cloud/firestore';
import { Epic, EpicTask, EpicStatus } from '../state/types';
import { v4 as uuidv4 } from 'uuid';

export class EpicService {
  private db: Firestore;
  constructor(db: Firestore) { this.db = db; }

  async createEpic(orgId: string, data: CreateEpicParams): Promise<Epic> {
    const epicId = uuidv4();
    const epic: Epic = {
      id: epicId,
      orgId,
      title: data.title,
      description: data.description || '',
      status: 'draft',
      // ... 300 more lines of implementation
      // Plus imported files, tests, UI components...
      // All serialized as flat text
    };
    // ... continues for the entire file
  }
// ... plus 8 more files of raw source code
// dumped into the context window
// with no structural information
// about how they relate to each other
// or what the agent actually needs to know
// to answer the question...
After: Graph Context
~2,600 tokens
Epic 6 fields epic- service epic- routes API UI #247 Issue Epic Task draft→active→done EpicStatus MANAGES SERVES AFFECTS HAS_SUBTASK

~50% fewer tokens today. The graph context delivers the same structural understanding in ~2,600 tokens that raw source code requires ~5,200 tokens to convey. As tools gain LSP-based code access, the token gap will narrow — but the graph provides relationship signals (co-change coupling, domain models, issue links) that no file dump or language server can surface.

The Hidden Coupling Signal

The CO_CHANGES edge is uniquely valuable. Static analysis can tell you what code can call what. Git history tells you what code actually changes together. When two files have a high co-change weight but no direct import relationship, you've found hidden coupling — the kind that causes unexpected breakage during refactors. No amount of raw text context will surface this.


What This Looks Like in Production

Everything described above — the five-phase pipeline, the graph context, the token reduction — isn't a theoretical exercise. It's the infrastructure behind aictrl.dev, the AI workflow orchestration platform we built because we needed it ourselves.

When we started coordinating AI agents across a TypeScript/React codebase, we hit every failure mode the research predicts: agents hallucinating file paths, duplicating work across stack layers, losing context mid-task. The knowledge graph was our fix. Here's what it enables in practice.

Stack Configuration: Your Architecture as Code

Define your architectural layers — Database, API, UI, Testing, DevOps — and map them to your codebase with glob path patterns like server/** or ui/src/**. The KG pipeline uses these rules to classify every file into its layer, creating IN_LAYER edges that give agents structural awareness. Assign specialist agents (backend-developer for API, qa-expert for Testing) and skills per layer so the right expertise is applied to the right code.

This feeds directly into every agent session. When an agent gets a task, it already knows which layer it's working in, what skills apply, and what architectural boundaries to respect. Teams can override org-level layers or add their own without affecting others — the same flexibility you expect from any layered configuration system.

Why Layer Classification Matters

Without stack awareness, an agent treats server/api/epic-routes.ts and ui/src/pages/EpicPage.tsx as equally relevant to any task. With IN_LAYER edges, the agent knows one is API, the other is UI — and scopes its changes accordingly. Combined with MANAGES, SERVES, and DISPLAYS edges, agents understand not just where code lives but what role it plays in the architecture.

KG Chat: Ask Questions, Get Graph-Grounded Answers

KG Chat is an LLM-powered conversational interface that reasons over your knowledge graph. Ask questions in natural language — "What depends on the session manager?", "Which files will be affected if I change the Epic type?", "What's the blast radius of refactoring the auth middleware?" — and get answers grounded in graph structure, not raw text search.

Under the hood, the LLM executes multi-hop graph traversals via tool calls: following IMPORTS edges, checking CO_CHANGES weights, tracing AFFECTS relationships from issues to code. This is exactly the pattern the GraphRAG-Bench research validates: complex, relationship-heavy queries where graph context delivers categorical accuracy improvements over flat retrieval.

MCP Tools: Structured Context for Any AI Agent

The knowledge graph isn't locked inside our UI. It's exposed via Model Context Protocol (MCP) — the open standard Anthropic created for connecting AI agents to data sources. Any MCP-compatible agent (Claude Code, Cursor, custom agents) can query the graph through two universal tools:

query_context
Explore code, domain models, issues, stack layers, skills, and sessions — returns graph-structured context, not file dumps
update_backlog
Create, update, and complete tasks with evidence linking — agents write back structured results, not untracked comments

This is the "graph context" panel from Part 5 in action: instead of dumping ~5,200 tokens of raw source code into an agent's context window, the MCP tools deliver ~2,600 tokens of structured relationships. The token savings (~50% today) matter less than what's *in* those tokens: co-change edges, domain model links, issue relationships, and cross-layer dependencies — signals that raw file context and even LSP indexes don't capture.

Skills Governance: Version Control for Agent Instructions

The knowledge graph tells agents what your codebase looks like. Skills tell agents how to work with it. aictrl treats agent instructions as production artifacts — versioned, governed, and measurable:

Skills Library. Reusable, versioned instructions organized by stack layer (UI, API, DB) and SDLC phase (design, develop, test, deploy). A skill might encode "how to write Firestore integration tests in this project" or "the review checklist for API route changes."

Governance Workflows. New skills go through approval before they're active. Organizations set policies for quality gates, scoring, and exceptions. Skills propagate across repositories with rollback capability — like GitOps for agent behavior.

Usage Analytics. Track which skills get invoked, by which tools (Cursor, Claude Code, API, task executor), how often, and for how long. This is the ROI measurement layer: you can quantify which agent instructions actually improve outcomes and which are dead weight.

Why This Matters for the KG Story

A knowledge graph without governed agent behavior is a map without a driver. The graph provides context — what exists, how it connects. Skills provide intent — what to do, how to do it right. Combined, they solve both failure modes: hallucination (wrong context) and inconsistency (wrong process). This is the full "context engineering" stack Karpathy described.
ctrl.knowledge

Explore the Knowledge Graph Feature

See the interactive pipeline, live demos, and a full walkthrough of how aictrl.dev auto-builds structured context from your repositories — and exposes it to AI agents via MCP tools.

Explore the Feature

The Market Is Moving

If the research makes the case for knowledge graphs, the market validates it. Every major platform is betting on structured context as the foundation for AI agents.

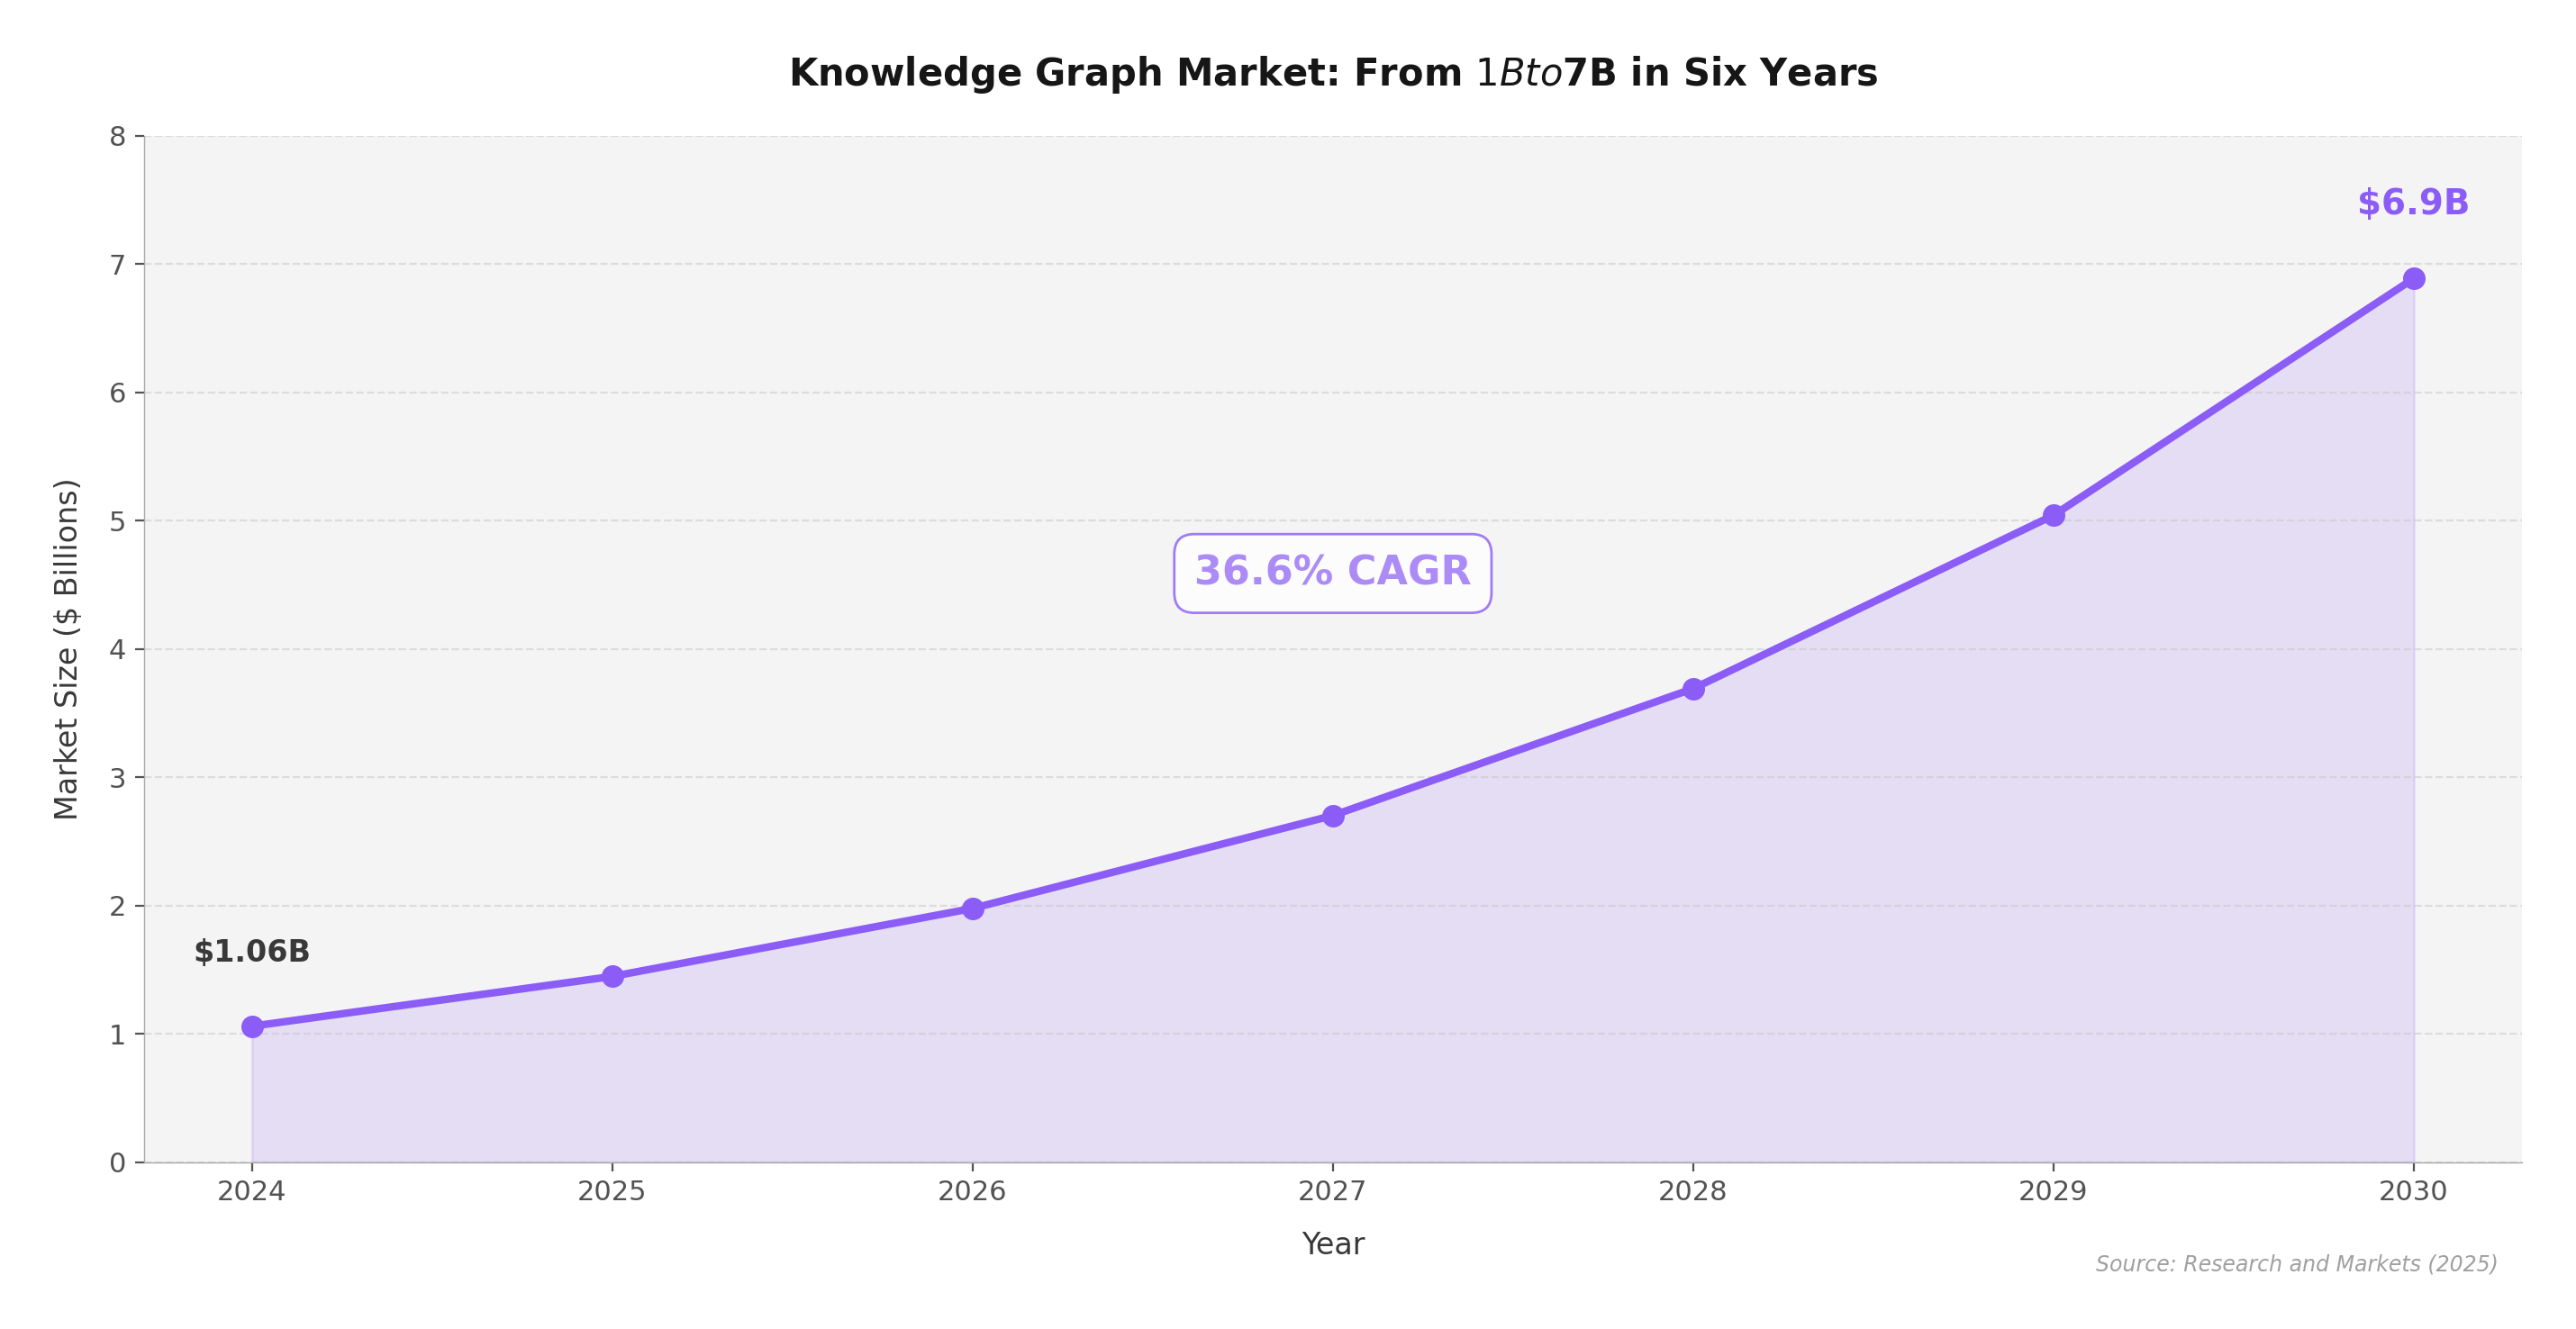
Knowledge graph market growing from $1.06B in 2024 to $6.93B by 2030 at 36.6% CAGR
The Knowledge Graph Market Explosion. A $1 billion market growing at 36.6% CAGR, driven by enterprise AI requirements for structured context, multi-hop reasoning, and regulatory compliance.

The Platform Bets

Microsoft shipped GraphRAG 1.0 (April 2025) and LazyGraphRAG (June 2025), integrating both into Azure Discovery for enterprise scientific research. The GitHub repo became one of the most-starred in AI tooling.

Anthropic made perhaps the most telling architectural choice: when they released the Model Context Protocol (MCP) in November 2024 as the open standard for connecting AI agents to data, the official reference implementation for persistent memory was a knowledge graph. Not a vector store. Not a key-value database. A graph.

Neo4j launched Infinigraph (September 2025) for 100TB+ scale, Aura Agent for no-code graph agent building, and a $100M global startup program backing graph-native AI founders.

dbt Labs released the dbt MCP Server v1.0 and dbt Agents at Coalesce 2025, making governed semantic layer metrics a first-class interface for AI agents. They also open-sourced MetricFlow, the technology powering the dbt Semantic Layer.

Palantir is the enterprise proof point. Their Ontology-driven AIP platform generated $1.2 billion in Q3 2025 revenue with 63% year-over-year growth — the strongest commercial validation that ontology-grounded AI agents outperform raw-data approaches in production.

"AI and analytics are converging faster than ever — but without semantics, there's no foundation for trust."

— David Mariani, CTO and co-founder, AtScale

The Code Knowledge Graph Race

A specific subcategory is emerging: knowledge graphs built from software engineering data. Both Potpie AI ($2.2M pre-seed, February 2026) and Cognee (€7.5M seed, February 2026) were funded in the same month, validating the category. GitLab shipped a native Knowledge Graph feature in version 18.4. Sourcegraph 7.0 explicitly positioned itself as "the intelligence layer for AI coding agents." And aictrl.dev is building the full orchestration stack — knowledge graph, skills governance, and agent analytics — designed for engineering teams that need to measure and govern AI agent behavior, not just enable it.

One customer of Potpie AI reported reducing root cause analysis from nearly a week to approximately 30 minutes on a 40-million-line codebase. The Prometheus research system resolved 28.67% of SWE-bench Lite issues at $0.23 per issue using a codebase knowledge graph.

The Forrester Business Case

Forrester's Total Economic Impact study of enterprise knowledge graphs documented 320% ROI over three years, with $9.86 million in total benefits. Data scientists reported 75–95% time savings on primary tasks. Analytics applications were built 2–3x faster. This remains the most rigorous quantified business case for enterprise knowledge graph investment.


The Infrastructure Bet: From Raw Data to Reliable Agents

Knowledge graphs are not a feature. They're infrastructure. Like databases, message queues, and observability platforms before them, they're the invisible layer that makes everything above them reliable.

The Semantic Layer Stack for Agentic AI USERS Developers, PMs, Executives — ask questions in natural language "What depends on this service?" AI AGENTS Claude, GPT, Gemini — reason over structured context via MCP tools Multi-hop graph traversal SEMANTIC LAYER Domain ontology, business metrics, governed definitions — meaning over data 33% → 90% SQL accuracy KNOWLEDGE GRAPH Entities, relationships, lineage, provenance — structure over chaos 80-97% token reduction RAW DATA Git repos, issue trackers, databases, documents, APIs — unstructured, siloed 16% accuracy · 63% hallucination INCREASING STRUCTURE & RELIABILITY →
Each layer adds structure, context, and reliability. Most enterprises feed raw data directly to AI agents (bottom → top, skipping the middle). The knowledge graph and semantic layer are the missing infrastructure.

The organizations that will succeed with AI agents in 2026 and beyond are the ones investing in this middle layer now. Not because it's trendy — Gartner has placed knowledge graphs in the "Slope of Enlightenment" in the 2025 Hype Cycle, indicating mature, production-ready technology — but because it solves the fundamental engineering problem that causes 95% of pilots to fail.

Where to Start

You don't need to build a full knowledge graph on day one. The path is incremental — and each step delivers standalone value:

Step 1: Ground Your Agents. Define reusable, versioned instructions for how AI agents should work with your codebase. This is the skill layer — governed agent behavior that turns ad-hoc prompting into repeatable process. On aictrl.dev, this means creating skills organized by stack layer and SDLC phase, with approval workflows and usage tracking from day one.

Step 2: Build the Graph. Connect your repositories to auto-generate a knowledge graph — code structure, domain models, stack topology, git history, and issue relationships. No manual curation: the five-phase pipeline described in Part 5 runs incrementally on every push. Your agents start querying graph-structured context instead of raw file dumps.

Step 3: Close the Loop. Measure what works. Track which skills get invoked, by which agents, how often, and whether they produce quality outcomes. Use the analytics to prune dead instructions, double down on effective patterns, and quantify ROI for leadership. This is the layer that turns "we use AI" into "we can prove AI is working."

The aictrl.dev Stack

This three-step path maps directly to the aictrl.dev platform: Skills Governance (Step 1) gives you version-controlled agent instructions with approval workflows. Knowledge Graph (Step 2) auto-builds from your repos and exposes structured context via MCP tools. Analytics (Step 3) tracks skill usage, quality gates, and team productivity across Cursor, Claude Code, and custom agents. Each layer works independently — start where it hurts most.

"I really like the term 'context engineering' over prompt engineering. It describes the core skill better: the art of providing all the context for the task to be plausibly solvable by the LLM."

— Tobi Lütke, CEO, Shopify

The knowledge graph is how you engineer that context at enterprise scale. The research is clear. The market is moving. The regulatory clock is ticking. The question isn't whether your AI agents need structured context — it's whether you'll build the infrastructure before your competitors do.

Ready to build the missing infrastructure layer?

aictrl.dev brings knowledge graphs, skills governance, and agent analytics together in one platform.

Get Early Access
See the full Knowledge Graph feature page — interactive pipeline, live demos, and deep-dives on every stage.

Sources